Students’ gameplay log data provides valuable insights into their behavior patterns during educational game use (Kleinman et al., 2020; Pan et al., 2023). Analyzing this data enables educators and researchers to monitor gameplay trajectories for both individual learners and groups (Liu et al., 2023). A key benefit of log data analysis is that it offers instructors an alternative way to assess changes in students’ activities over time (Udeozor et al., 2021). This proposal introduces an innovative method to help instructors and researchers evaluate student performance by identifying disruptive patterns in longitudinal gameplay data. These patterns may reveal significant leaps or declines in gameplay behavior. To achieve this, researchers propose applying change point analysis to detect shifts in students’ gameplay behaviors and explore their instructional implications. Additionally, this method facilitates the detection of change points for both individual students and groups, guiding the following research questions:
RQ1. How can individual students’ change-point gameplay be detected and interpreted over an academic year using behavioral log data?
RQ2. How can gameplay change points be identified and interpreted for students from varying gamification conditions over an academic year?
Fifty-nine 5th-grade students from four math classes in a Northeastern US school participated in a study using a gamified problem-based learning platform, First-in-Math (FIM, n.d.), comprising 260 math problem-solving games aligned with K-8 math standards (see Figure 1). FIM was used throughout an entire academic year, with students typically spending 15-20 minutes on the platform during class sessions where it was utilized by teachers. Digital stickers were awarded upon successful problem-solving. In two classes, students engaged with FIM at the beginning of the class as a preview activity (Condition-A), while the remaining two classes interacted with FIM toward the end as a review activity (Condition-B).
Figure 1
Interface of the Gamified Problem-Solving Activity Structure in First in Math (FIM)

Students generated 114,186 log entries on the FIM platform during gameplay, capturing Student ID, Time of the Action, Game Name, and Stickers Awarded. Logs were categorized weekly, aligning with teachers' usage of FIM three days per week according to the lesson plan. To address the first research question, researchers utilized change point algorithms to visualize changes in daily stickers earned and total games played. For the second question, change point analysis was conducted separately for each condition, presenting visualizations of change points for daily stickers earned and total games played.
The PELT algorithm (Pruned Exact Linear Time), introduced by Killick and Eckley (2012), was employed in this study to detect change points in time series data. A change point represents a point where the statistical properties of the data, such as mean, variance, or trend, undergo a significant shift. PELT segments the data into intervals with uniform statistical characteristics by optimizing a cost function that measures the fit within each segment. To avoid overfitting, the algorithm incorporates a penalty term for the number of change points, striking a balance between model complexity and accuracy. Its computational efficiency and scalability make PELT particularly suitable for analyzing large-scale datasets.
Figure 2 illustrates the change point patterns in the daily stickers earned by a student over a span of 44 weeks. The x-axis represents the total weeks observed, while the y-axis indicates the cumulative number of stickers earned. The black line captures weekly fluctuations in sticker accumulation, while the red horizontal lines denote distinct segments identified by a change point detection algorithm, each indicating a shift in the mean level of sticker earnings. The algorithm detected five change points, segmenting the data into six phases. A particularly notable change point occurs around Week 5, marking a transition from an initial phase of high sticker accumulation to a significantly lower and more stable level. This shift may reflect an early peak in engagement with the gamified problem-solving tasks, followed by a decline, potentially due to increasing student familiarity with the program or changes in instructional pacing.
Figure 2
Visualization of an Individual Student's Change Point in Daily Sticker Earned
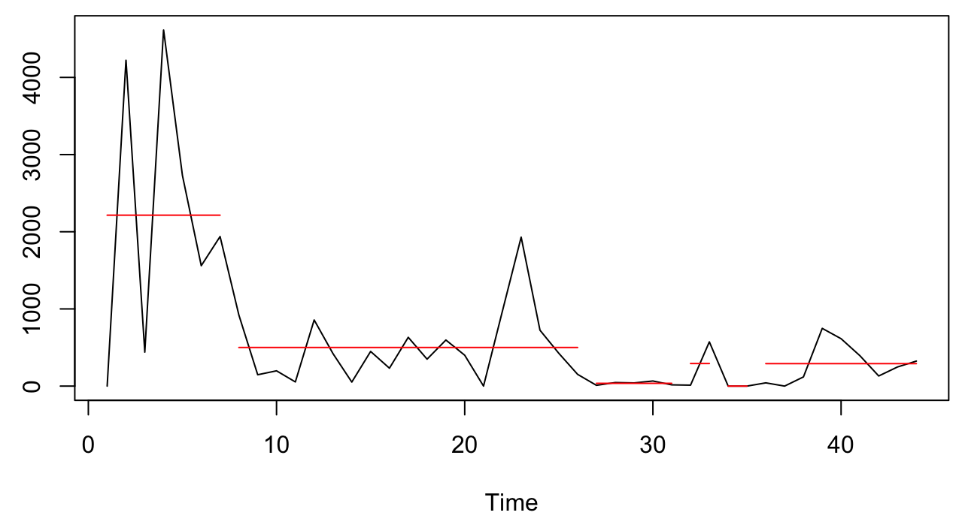
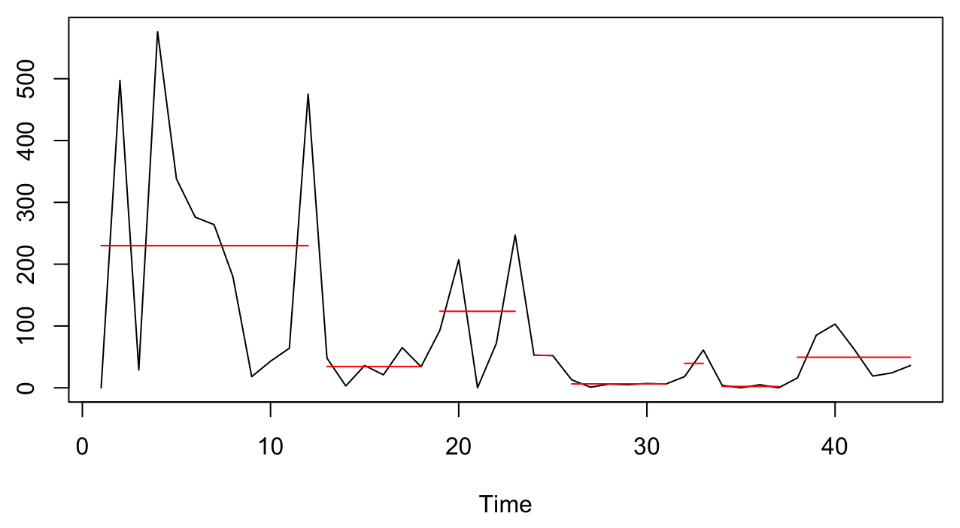
Figure 3 shows the change points of the total number of games students played. The initial participation pattern is also high, but appears more gradual than the patterns in Figure 2. This indicates that the student was consistently playing a large number of games early on, regardless of the stickers. Around Weeks 10–20, the number of games played remains low but stable, with occasional increases. However, in Figure 2, sticker accumulation shows more fluctuations, indicating that even when the student continued playing, their performance varied—possibly due to increasing difficulty, reduced motivation, or shifts in problem-solving strategies. In the final weeks (Weeks 35–44), the number of games played shows a slight increase, while stickers earned remain lower than in the initial phase. This suggests that although the students returned to playing more frequently, they were not earning rewards at the same rate. This pattern could indicate struggles with more complex problems, changes in engagement levels, or a shift in motivation.
Figure 3
Visualization of an Individual Student's Change Point in Daily Total Games Played
Students in Condition A engaged with FIM as a preview or warm-up activity, whereas students in Condition B interacted with FIM after instruction as a review session. Figure 4 compares the change point patterns in daily stickers earned between the two conditions.
A key difference is observed in the early phase (Weeks 1–10). In Condition A (preview), sticker accumulation starts high but gradually declines, indicating strong initial engagement but a potential decrease in effectiveness over time. In contrast, Condition B shows a more structured increase in sticker accumulation after an initial rise, suggesting that prior instruction may have better prepared students for success in FIM. Another notable difference is the mid-phase (Weeks 10–30), where Condition B exhibits more fluctuations, while Condition A shows a steadier but lower trend. This could imply that students in Condition B, having already received instruction, engaged more dynamically with the game, applying what they learned, whereas those in Condition A might have relied more on trial and error.
Figure 4
Comparison of Students' Change Point in Daily Stickers Earned between Two Conditions
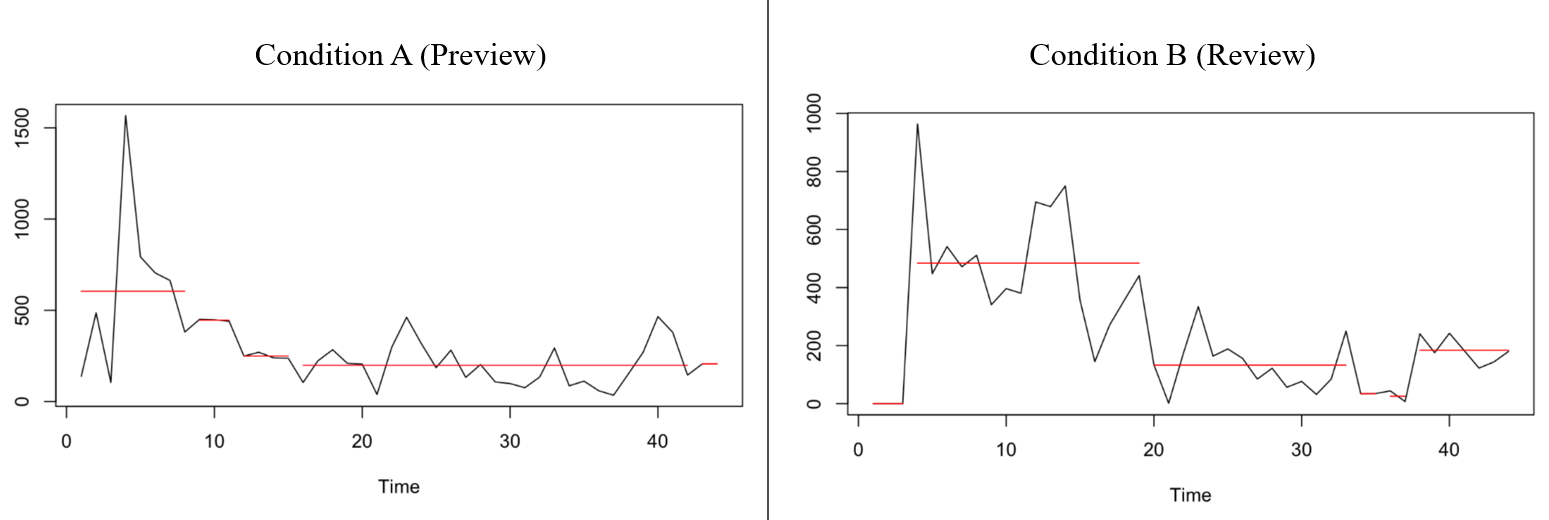
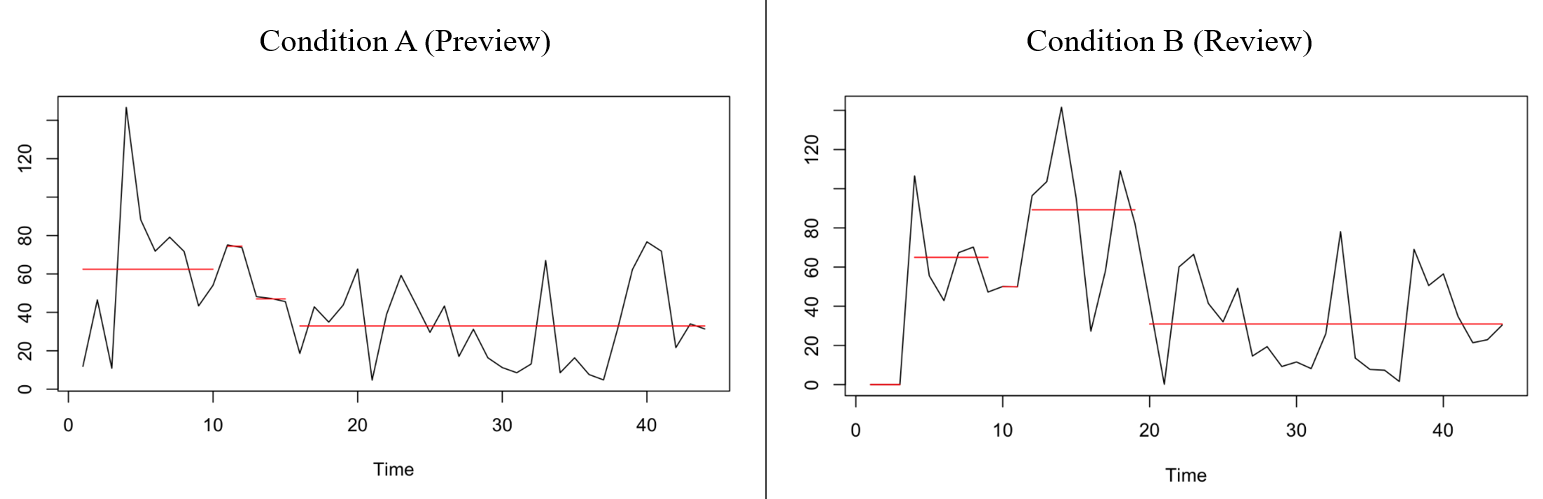
Figure 5 shows the comparison of the change point patterns on total games played between the two conditions. Students in Condition A (play FIM as a preview) showed a sharp decline in game participation after an initial peak, suggesting early enthusiasm that faded, possibly due to trial-and-error frustration without prior instruction. In contrast, Condition B (review) showed more sustained engagement with multiple fluctuations, indicating that prior instruction may have helped students feel more prepared and confident, encouraging them to play more consistently. The key difference likely stems from how students approached the game—those with instruction first (Condition B) may have had better problem-solving strategies, leading to more persistent participation, while those in Condition A may have disengaged as challenges increased. This suggests that using FIM as a review tool rather than a preview activity might lead to more sustained engagement and learning benefits.
Figure 5
Comparison of Students' Change Point in Daily Total Games Played between Two Conditions
Comparing change points in both stickers earned and total games played provides a more comprehensive understanding of student engagement and learning patterns. While stickers earned reflect performance and problem-solving success, games played indicate participation and motivation. Analyzing both metrics together helps identify whether students are disengaging due to lack of effort (fewer games played) or struggles with content (consistent play but fewer stickers earned). For example, students in Condition B (instruction first) showed more sustained gameplay and sticker accumulation, suggesting instruction helped maintain engagement and performance. In contrast, Condition A (game first) saw early declines in both metrics, indicating that trial-and-error without prior knowledge may have led to frustration. Measuring both provides deeper insights into how instructional timing impacts engagement and learning outcomes.
Several practice implications could be drawn from the outcomes. Firstly, the above data indicate a disparity between the trends of daily stickers earned and daily total games played, which may be due to students’ motivation shift or biases in game design. Secondly, compared to students in Condition A, students in Condition B maintained prolonged active involvement, which indicates FIM may be more suitable after students have some initial knowledge. Thirdly, teachers can use the above data to find the root cause of the drop, for example, whether the drop in students’ engagement in FIM correlates with events in the academic calendars, such as providing before/after exams or during breaks. Last but not least, timely intervention can help maintain students’ interests, which includes potential modification of curriculum design and game design.
This study applied change point analysis to students’ gameplay log data to identify significant shifts in engagement and performance within a gamified mathematics learning environment. By capturing both individual and group-level behavioral changes, the analysis revealed that students using FIM as a review activity demonstrated more stable and sustained engagement than those using it as a preview. These findings highlight change point detection as a valuable methodological approach for identifying meaningful transitions in learning behavior and guiding data-informed pedagogical decisions. Future research may expand this framework to incorporate additional behavioral or motivational indicators and explore real-time applications to support adaptive, personalized learning interventions.