Introduction
Curriculum mapping is a process for recording which content and skills are taught in a program of study; it is typically communicated through a chart, table, or map, depicting the building blocks of the coursework and academic program (Burns & de Silva Joyce, 2001). Different building blocks warrant differing visual structures. To further work in the competency-based education research and practice field (Burnette, 2016), we explore using competencies as the curriculum’s central unit or building blocks. Competencies represent tightly coupled knowledge, skills, abilities, and behaviors. Understanding the relations among competencies is essential to drive meaningful training and assessment. We argue that the unique nature of competencies as curricular building blocks demands different ways information is organized and visualized by multiple stakeholders (such as learners, educators, designers, and policymakers).
This case study examines a four-part process—plotting, meaning-making, negotiating, and bounding—with subject-matter experts (SMEs) informed by multidimensional scaling (MDS) across two design cycles. The first cycle describes our quantitative methods using scaling judgments as our MDS data inputs. SMEs rated the similarity and dissimilarity of competencies areas. Then, an MDS analysis was used to measure how closely different competencies were related and plotted which competencies were closer or farther apart. If the competencies were rated as being very similar, they would be plotted or positioned closer together in space. We propose using MDS to create a competency map as a baseline for refining curriculum with SMEs. The second design cycle takes a qualitative and design-centric turn. In this cycle, we describe how the mathematical and geometric output of MDS was rendered to create a competency neighborhood map that multiple stakeholders could easily read and use. We argue that competency maps can aid in content sequencing, developing multiple mastery paths, and validating authentic, aligned assessments (Kingston et al., 2017). We also offer several techniques that support methodologically rich and informed maps, representing complex relational information in ways not possible with traditional curriculum maps.
This design study is derived from the close collaboration among psychometricians, learning designers, and SMEs, and the purpose of this study is twofold. First, it examines the usefulness and affordances of using an MDS method to organize and facilitate understanding competencies in a law enforcement officer (LEO) curriculum. Second, we follow the design and communication implications of rendering this method usable to learning designers and the wider public. By taking an interdisciplinary collaborative approach, we contribute to the growing body of theory, practice, and methodologies around learning maps. Furthermore, we describe mapping’s potential impact on competency-based education (CBE) research and practice field.
CBE is a method for preparing students based on graduate outcomes and structured on competencies generated from analyzing societal needs (Frank et al., 2010; Timmerberg et al., 2022; Wong, 2019). CBE represents a shift from traditional, time-based education models to a focus on mastering specific skills or knowledge areas. In the fullest expression of CBE, time is variable rather than constant, unlike traditional credit or semester-driven organizations. Thus, learners may be able to demonstrate competencies in different combinations at different times. However, the learning infrastructure, data collection, and analytics capabilities in learning-management platforms have historically lagged behind the level of sophistication and scale that CBE aspires to reach, particularly in support of program improvement, comparison of program outcomes across institutions, administrative decision-making, and other research needs (Garavan & McGuire, 2001).
While CBE approaches hold great promise, there are several barriers to their widespread adoption across educational intuitions, especially in higher education. These barriers include the lack of standardized frameworks and design vocabulary (Book, 2014; Le et al., 2014); the challenge of developing meaningful, authentic assessments (Glaser et al., 1997; National Research Council, 2001; Resnick & Resnick, 1992); and a lack of empirical research of CBE in driving design and development (Kelly & Columbus, 2016). Our work seeks to add to the theorization of methods and assessment development of CBE through a competency-mapping design process using a mixed methods approach.
CBE demands more granularity than traditional curricula, which are often organized by temporal aspects (week, module, course, semester). Instead, CBE curriculum must be dynamically and relationally organized across competencies, content, and assessment. We aim to forward a curricular mapping methodology that navigates the opportunities and challenges of competency-based educational (CBE) approaches.
This work is situated in broader design research around mapping curriculum and learning (Duarte et al., 2021; Holmes et al., 2018; Huang & Willcox, 2021; Willcox & Huang, 2017). We anchor our theoretical and methodological cues by taking a cartographic approach to educational data. This method means we adopt cartographic metaphors to understand curriculum (e.g., paths, regions, boundaries) and apply methodical practices to visualize and communicate curriculum spatially to find or emphasize trends, relationships, or patterns. A cartographic approach is compelling for CBE learning design, which must account for personalization, flexibility, content alignment, competencies, and assessment. Willcox and Huang (2017) suggested that maps better represent the complexity of relationships in educational data. They argue that linear, static models cannot adequately represent the specific connections (i.e., linkages) as well as maps can. Broadly, we describe our work as curricular cartography, which seeks to map curricular, programmatic, and other institutional forms of data, depicting critical connections and relationships in ways that support rich analysis and evaluation of academic programs and learning achievement.
Curriculum mapping involves visualizing an educational program and outlining the sequence of classes, units, objectives, and standards. While it supports curriculum design and assessment, traditional methods often fall short in scalability and analytical capabilities, as they typically represent data in static, table-based formats. These formats are often only intelligible to their creators. Such formats obscure complex relationships within the data and limit cross-cutting analysis of concepts and standards (Willcox & Huang, 2017; Grimmelmann, 2011; Guarino, 1992). The linear structure imposed by such maps suggests a fixed learning progression, which does not account for the non-linear nature of competency development. Competencies may require deep exploration rather than just moving to the next step. Traditional curriculum maps also struggle to accommodate the evolving nature of skills, as they lack the dynamic adaptability that interactive maps could provide. These limitations highlight the need for more sophisticated mapping techniques to visualize and analyze educational data at scale, offering a clearer understanding of curriculum alignment and program effectiveness (Willcox & Huang, 2017; Long & Siemens, 2011; Kingston et al., 2016).
In CBE, precise alignment of outcomes, assessments, and learning materials becomes essential, necessitating a more nuanced approach. CBE program development starts with defining the outcomes (e.g., competencies). Additionally, competencies must be understood in terms of how they relate to each other before the curriculum can be developed. Therefore, we consider how designers might transcend traditional graphic representations such as grids and tables.
Before designers can map backward, we may want to think more topographically since “backward” design moves across a single plane. We posit that designers need to think relationally (up–down, right–left, across, between) by building upon the concept of competency neighborhoods (Kingston & Broaddus, 2017). We describe a competency neighborhood as a cluster of competencies that have multiple relationships to each other. The nature of that relationship, in other words, the boundaries of competencies neighborhoods, can be derived from expert judgment, professional standards, cognitive research, or any combination of these elements. We offer a mixed-methods approach to explore how competencies can be clustered to provide a more holistic understanding of learning and skill demonstration.
While competency mapping can and should be a precursor task to developing a curriculum, in this design case, we analyzed a curriculum that had already been designed. Therefore, the mapping process described here was intended to provide validity and insight into program evaluation process and ongoing improvement. In the discussion, we offer suggestions for additional ways our MDS-inspired method may be used in other phases of curricular design or analysis processes.
MDS is a set of statistical techniques used to describe the dimensional structure underlying the competency areas (see Takane et al., 2009; Young & Hamer, 1987, for more in-depth descriptions of MDS). In this study, we used ratings of the similarity on a five-point rating scale of each competency area compared to every other competency area as our data inputs. SMEs rated the similarity and dissimilarity of competency areas. Then, an MDS analysis was conducted to calculate how closely the competencies were related. If competencies are very similar, they would be plotted or positioned closer together in space. On the other hand, dissimilar competencies are positioned farther apart.
To illustrate how MDS functions, consider the analogy of mapping cities based on their mileage distances. While a list of distances between cities provides no direct indication of their relative locations, MDS attempts to place each city on a map so that the distances on the map closely approximate the given mileage. For example, if two cities, A and B, are 300 miles apart, MDS would position them on a straight line with 300 units between them. Introducing a third city, C, 400 miles from A and 500 miles from B, requires placing C off the straight line, thereby creating a second dimension on the map. As more cities (or data points) are added, MDS continuously adjusts their positions to best align with all the mileage data, resulting in dimensions visually representing the relationships among the cities. In summary, MDS arranges data points in a geometric space so that the distances between them reflect the original data, thus creating a map with multiple dimensions that capture these relationships.
Determining the number of dimensions is important in using MDS to organize and display competency areas. The number of dimensions affects the calculation of the coordinates for the visual display, and selecting the appropriate number of dimensions is essential for developing a valid visual display, so we will return to a geographical map to describe dimensions. A dimension is commonly defined as a measure of things or people on one attribute (e.g., distance). However, a reference point is needed to use miles to look at a one-dimensional representation of cities. In this example, we will use Lawrence, Kansas, and measure the miles of each city from Lawrence. Table 1 shows the distance in miles from Lawrence to each city, and Figure 1 displays this one-dimensional solution.
Table 1
Distance of 10 Cities from Lawrence, Kansas, in Miles (mi)
| City | Miles from Lawrence Distan (mi) |
|---|---|
| 1. Atlanta | 829 |
| 2. Chicago | 548 |
| 3. Denver | 566 |
| 4. Houston | 713 |
| 5. Lawrence | 0 |
| 6. Los Angeles | 1,539 |
| 7. Miami | 1,501 |
| 8. New York | 1,231 |
| 9. San Francisco | 1,775 |
| 10. Seattle | 1,860 |
| 11. Washington DC | 1,109 |
Note. From Google Maps, by Google (Lawrence - Google Maps). In the public domain.
Figure 1
Display of Distance of 10 Cities from Lawrence, Kansas, Using One Dimension
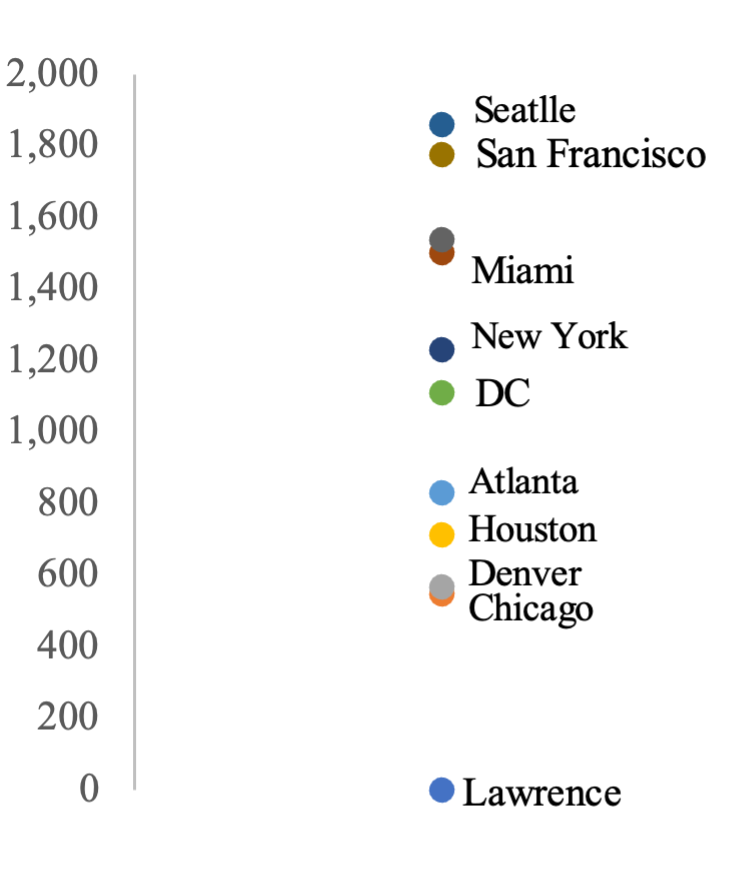
As seen in Figure 1, the result of a one-dimensional visual display using the data from Table 1 shows each city’s distance from Lawrence, Kansas. Because we know the meaning of “miles,” we do not need a theory, reasoning, or conceptual analysis behind the visual display to describe and label the dimension. However, MDS is used to understand multiple dimensions. In our second analogy, we seek to understand the relational distance across the cities representing two dimensions of north-south and east-west geographical directions. The basis for the MDS analysis is the distance in miles between cities, shown in Table 2. The two north-south and east-west dimensions are represented in Figure 2, using the coordinates calculated by MDS for two dimensions.
Table 2
City | City | |||||||||||
|---|---|---|---|---|---|---|---|---|---|---|---|---|
| ATL | CHI | DEN | HOU | LAW | LA | MIA | NYC | SF | SEA | DC | ||
| ATL | 0 | |||||||||||
| CHI | 717 | 0 | ||||||||||
| DEN | 1,402 | 1,002 | 0 | |||||||||
| HOU | 793 | 1,074 | 1,038 | 0 | ||||||||
| LAW | 829 | 548 | 566 | 713 | 0 | |||||||
| LA | 2,175 | 2015 | 1,019 | 1,547 | 1,539 | 0 | ||||||
| MIA | 695 | 1,378 | 2,066 | 1,187 | 1,501 | 2,733 | 0 | |||||
| NYC | 864 | 790 | 1,778 | 1,657 | 1,231 | 2,777 | 1,279 | 0 | ||||
| SF | 2,473 | 2,131 | 1,271 | 1929 | 1,775 | 383 | 3,135 | 3,073 | 0 | |||
| SEA | 2,636 | 2,064 | 1,305 | 2,264 | 1,860 | 1,143 | 3,359 | 2,831 | 821 | 0 | ||
| DC | 638 | 697 | 1,657 | 1,431 | 1,109 | 2,671 | 1,052 | 226 | 2,813 | 2,737 | 0 | |
| Column 1 | Column 2 |
|---|---|
| 1, 1 | 1, 2 |
Note. Cities are ATL = Atlanta, CHI = Chicago, DEN = Denver, HOU = Houston, LAW = Lawrence, LA = Los Angeles, MIA = Miami, NYC = New York, SF = San Francisco, SEA = Seattle, and DC = Washington, DC.
From Google Maps, by Google (Lawrence - Google Maps). In the public domain.
Figure 2
Display of Two-Dimensional Multidimensional Scaling (MDS) Result of Distances Between 11 Cities
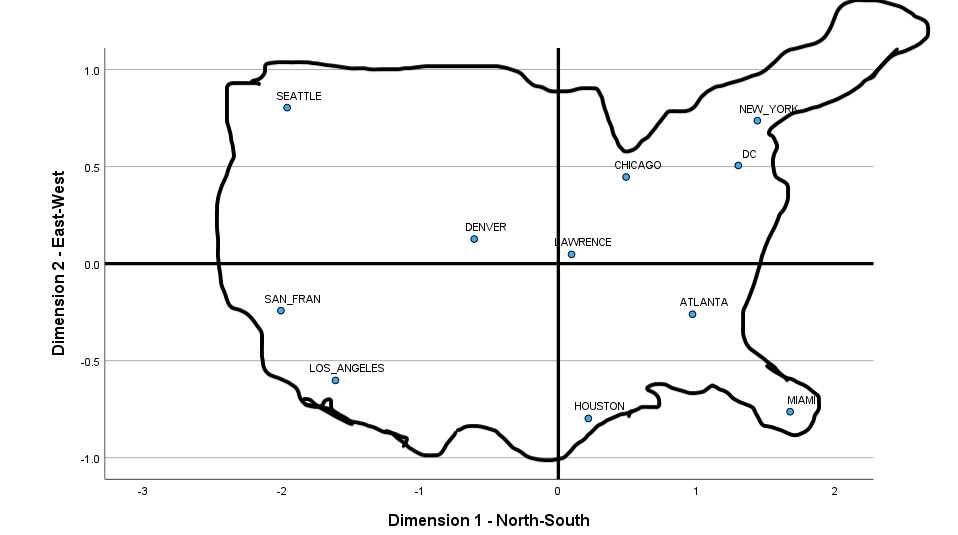
Note. Figure 2 shows the two-dimensional multidimensional scaling (MDS) result of distances between 11 cities. The north-south, east-west orientation is reified when superimposing a schematic of the United States. This example illustrates how MDS can be used to analyze data relationally in space.
As seen in Figure 2, the visual display of cities’ distances from each other in two dimensions depicts the east-west and north–southeast locations. The superimposed schematic of the United States reinforces the characterization of Dimension 1 (y-axis), showing north-south locations and cities toward the top are in the north. Likewise, Dimension 2 (x-axis) shows an east-west representation. Lawrence, Kansas, is correctly depicted by these MDS results toward the center of both dimensions.
In summary, based on understanding the scale (the distance in miles between cities), the number of dimensions used by MDS in calculating the coordinates of the cities (two dimensions), and using knowledge of the map of the United States, we can define and label each dimension with confidence based on the conceptual comparison of the visual display of the MDS results with the schematic map of the United States. So, through this reasoning and knowledge of the MDS analysis, we can define and label the dimensions used.
Meaningful maps are those in which the competency areas are clustered in explainable, rational patterns along the dimensions. This analysis uses stress and correlation = squared (RSQ) statistics and evaluation to explain and label each dimension. It is a common MDS practice to undertake an analysis with two dimensions first, then formulate a rationale and label the visual display for each dimension. Next, an analysis is repeated but specifies three dimensions and provides a rationale and label for each dimension’s visual display. Meaningfulness is achieved if the users can develop a reasonable label of the dimension that logically and rationally fits the placement of the competency areas along each dimension. Statistical information about how well the spatial alignments are represented in each set of dimensions is used to corroborate the rationale offered. The researcher initially makes judgments about the selection of the number of dimensions and the meaningfulness of the map. However, good practice dictates involving LEO SMEs (in this case, the chief curriculum developers ) to verify the judgments, enhance the rationale and labels of the dimensions, and select the most meaningful map. A key element in developing our curriculum maps relies on expert judgment developed through practice and gained through a collaborative deliberation process.
In summary, MDS is a scaling activity requiring psychometric expertise to generate a set of statistically based visual displays of the competency areas using various dimensions. At the same time, using MDS to inform scaling judgments hinges on the negotiation and meaning-making of experts. MDS uses similarity and dissimilarity ratings to measure how closely different areas of expertise (competencies) are related. To ensure the map is accurate and meaningful, experts in the field are consulted, and the map is refined until it reflects the relationships among areas as accurately as possible.
Curriculum is always, in some way, political. As in K–12 and higher education, law-enforcement education is a manifestation of sociopolitical contexts, competing interests, and histories. Because of the complexities of federal, state, and local contexts, the quality of training and professional values can differ from the views of the state or municipalities. Thus, policing education can be influenced by political trends and election cycles. For example, the law-enforcement profession has been called upon to implement more robust training around police violence and cultural awareness, especially after events such as George Floyd’s murder, which culminated in movements to defund the police (Boudreau et al., 2022). At the same time, states like Florida (DeSantis, 2021) and Texas (Yang, 2023), among others, have criticized cultural-, racial-, and gender-awareness programs in governmental agencies and higher education. Such legislation and rhetoric place curriculum that supports public peace and legal justice in a precarious position (Benet & McMilian, 2021). Law enforcement training is, justifiably, subject to a high level of scrutiny in all states. Navigating different and sometimes competing stakeholders’ values and interests is part of the curriculum-design process. Therefore, this complex curricular and public safety landscape demands new curriculum artifacts and analytical methods.
In response to broader social and national events and rising requests for transparency around police training, the law-enforcement-officer training center (LEO-TC) sought a design-research partnership with our research team (two design researchers and a psychometrician). At the time of the research partnership, LEO-TC educators had undertaken an extensive curriculum redesign and transitioned to a CBE model. The new curriculum was designed to be responsive and agile, interweaving a complex set of skills and ideas to support the development of competent novice officers. The approach needed to clearly articulate the competencies aligned to specific learning objectives and assessments. This clarity and transparency is essential for instructors, learners, and the public to clearly show what, how, and when law-enforcement professionals are taught the competencies and how to indicate their learning achievements. Furthermore, the need to point to data-informed justifications for breadth and depth of content and provide artifacts supporting the development of fair, authentic, and aligned assessment drove our broader research goal and values.
While the curriculum had been restructured as a CBE model, the redesign was recent and still being refined. In undertaking our mapping efforts, the SMEs encountered difficulty organizing the competencies of the training program into progressive pathways or related clusters of competencies. Design researchers thought MDS would help SMEs organize and structure their competencies. However, we did not know of or find any prior applications of MDS for this purpose. On the other hand, we did know of other classification or structure-building statistics, like cluster analysis using judgments or setting standards (Sireci et al., 1999). We selected MDS to develop the curriculum map because it directly uses the judgments of the SMEs. Additionally, MDS works with even just one rater because the unit of analysis is the competency area and not the number of raters. Building on those approaches and other experiences with nonlinear curriculum maps (Wilcox & Huang, 2017; Huang & Willcox, 2021), we undertook a novel application of MDS to the development of curriculum mapping, driven by two research questions:
This design study comprises two related phases that supported the LEO-TC administrators in organizing, updating, and communicating decision-making around the curriculum. The first cycle focused on developing MDS methodology as the initial SME competency rating survey. The MDS analysis results offered a baseline understanding for the second design cycle, which focused on iterative mapping exercises. The design cycles provide a methodology that makes SME judgments visible and supports negotiating and meaning-making across the design process. The following sections describe the methods in general, while the individual findings will provide the technical details of each step.
The design team comprised two instructional design researchers (IDs), a psychometrician, and two SMEs. The SMEs were the chief curriculum designers for the LEO-TC and were also the coauthors of the competencies. The psychometrician was involved in implementing the MDS methodology and assisting and guiding the interpretation of the MDS results. Within the research, we describe the IDs and psychometrician as the research team and the LEO-TC curriculum designers as our SMEs.
We provide a narrative overview of both design cycles and the procedures in Figure 3. We then attend to the details of each procedure as part of the design-cycle description. Design Cycle 1 began by reviewing the LEO-TC curriculum, which involved 36 competencies, 221 discrete learning objectives, 52 separate classes or courses, and 14 weeks of instruction. The competency-based curriculum had been implemented for less than six months at the time of the study. In the second activity, the IDs narrowed the mapping efforts to 11 of the 36 competency areas.
Figure 3
Overview of the Design Process and Methodology
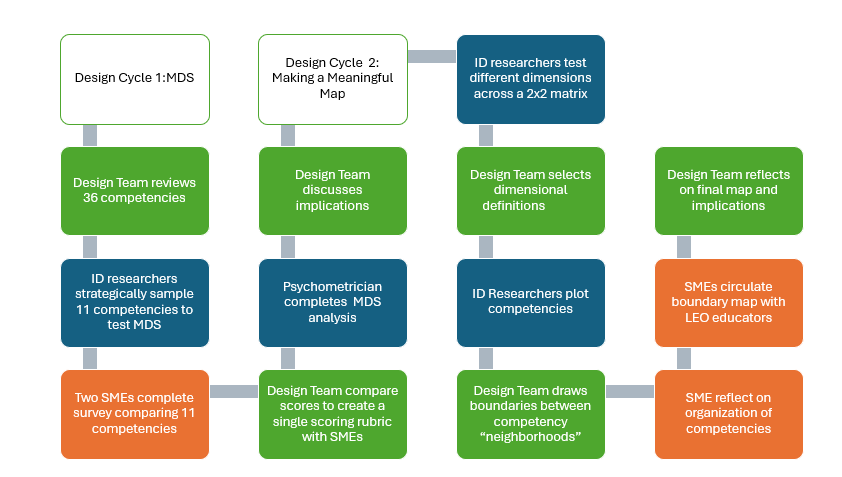
Notes. Overview of two design cycles. Design Cycle 1 focuses on the MDS analysis, and Design Cycle 2 focuses on developing a meaningful map. Activities involving the entire design team (IDs, psychometrician, and SMEs) are represented in green; activities involving only the ID researchers are represented in blue; activities involving only the SMEs are represented in orange.
Earlier, we described the general methodological procedures for MDS. The following section describes our specific procedures. The IDs and psychometrician discussed the results and selected the best solution for the number of dimensions from the several calculated. Design Cycle 2 began by using the results of the MDS. The design team discussed the map of the competency areas and developed the definitions and rationale for the dimensions. The design team also drew boundaries around clusters of competency areas and between neighborhoods of the competency areas according to the discussions of the meaning of the dimensions and what the sets of competency areas represent. IDs held meetings with SMEs to discuss the organization of the competency areas and validate the boundaries and labeling of the dimensions, neighborhoods, and clusters. SMEs distributed the competency map to LEO-TC educators for review and feedback. IDs and SMEs reviewed all feedback, adjusted according to the feedback, and finalized the competency-area map with neighborhoods and labeling. The following section describes our findings as we worked through the design procedures.
We focused our mapping efforts on 11 out of the 36 competency areas. These 11 competency areas were strategically sampled according to their perceived similarities or differences and comprehensive representation of the curriculum for the study’s purposes. Another reason for selecting fewer competency areas was to make the MDS methodology more practically feasible. The analysis required the SMEs to rate each possible pair of competencies as similar/dissimilar. Using all 36 competencies would necessitate ratings for 630 pairs of competency areas, so the IDs strategically sampled 11 competencies for comparison, creating a much more practical 55 pairs to be rated. Table 3 describes the 11 competency areas. SMEs were then given the information from Table 3 and instructed to rate these selected competency areas individually.
Table 3
Eleven Competency Areas, Number of Learning Objectives (LOs), and Competency Descriptions
| Competency area | No. of LOs | Trained officers will… |
|---|---|---|
| Police Liability (PL) | 9 | Identify and examine police action, or inaction, that exposes them to civil and criminal liability. The officer will analyze activities that may constitute civil-rights violations and develop awareness of ways to reduce liability risk. |
| Critical Incidents (CR) | 8 | Develop plans and identify resources for addressing uncommon, infrequent, or unexpected events that have a high probability of overwhelming officers. |
| Juveniles (JV) | 5 | Manage juvenile matters, including arrest or custody of juvenile offenders, while applying federal, state, and local guidelines and procedures to transporting, housing, or placement when the juvenile is a victim or a suspect. |
| Public Trust (PU) | 10 | Recognize the legitimacy of law enforcement by society built through community problem-solving, proper application of force, and analyzing and critiquing officer behavior as it affects community perception. |
| Law & Procedure (LP) | 8 | The duties required of a law-enforcement officer, including interactions with citizens, investigatory duties, and involvement in legal processes, using constitutional, statutory, and relevant legal understanding and application to protect the rights of citizens in furtherance of the intended outcomes of the judicial system. |
| Court (CT) | 8 | Explain the issues surrounding effective courtroom testimony, etiquette, and judicial proceedings. |
| Use of Force (UF) | 6 | Evaluate what constitutes lawful force actions within law-enforcement duties. |
| Search Warrants (SW) | 2 | Analyze information related to warrant requirements and exceptions in relation to the different types of search-and-seizure situations they may encounter during their career. |
| Domestic Violence (DV) | 8 | Respond to and investigate domestic disputes and related crimes by intervening and employing appropriate investigative and conflict-resolution strategies, understanding the causes and perpetuation of domestic-violence incidents, and addressing victims’ needs. |
| Communication (CM) | 3 | Effectively and professionally communicate with community members, the law-enforcement structure, supporting entities, court systems, and others to convey information consistent with the law-enforcement mission and community needs. |
| People in Crisis (PD) | 12 | Incorporate strategies to intervene and mitigate crisis events, focus on behavioral indicators from involved individuals, and successfully defuse situations. |
The IDs first oriented the SMEs to the rating process, after which the SMEs rated each pair of the 11 competency areas (55 ratings total) on a 1 to 5 scale using a rating-collection form developed by the psychometrician—the form listed competency areas in rows and columns, forming a matrix. A rating of 1 indicated high similarity, 5 indicated high dissimilarity, and 0 indicated no distance because the pair represented the same competency area. After completing their ratings individually, the psychometrician averaged them, created a single matrix, and calculated descriptive statistics for discussion.
MDS was implemented using IBM SPSS Statistics (Version 28), which used the alternating least squares scaling (ALSCAL) algorithm (Young et al., 1978). This statistical technique assessed the similarity and dissimilarity between competency areas, identifying their structure and positioning each on a point based on calculated coordinates. We tested solutions with two, three, and four dimensions, recalculating coordinates for each. The results were evaluated using stress and RSQ indicators.
Stress measures how well our constructed map fits the data by quantifying the difference between observed and estimated similarity and dissimilarity ratings. A lower stress value indicates a better fit. RSQ represents the proportion of variance in the scaled data explained by the distances in each dimension, with higher RSQ values indicating a more accurate representation. The research team graphed stress and RSQ for each dimension to assess alignment with the data, aiming to find the optimal number of dimensions that minimize stress and maximize RSQ.
After using different numbers of dimensions to generate potential solutions, we and our SMEs participated in a collaborative discussion. Together, the design team labeled dimensions and constructed rationales to elucidate the grouping of areas on the map. The solution that offered the most coherent and parsimonious representation, supported by clear labels and logical groupings, was chosen as the most fitting depiction of the data.
The two SMEs served as the raters. They rated 55 pairs of competency areas. Table 4 shows these ratings of similarity and dissimilarity (a greater value in the 1 to 5 scale represented less similarity between the pairs) for every unique pair of competency areas.
Table 4
Expert Ratings for Each Unique Pair of Competency Areas
| Competency Area | PL | CR | JV | PU | LP | CT | UF | SW | DV | CM | |
|---|---|---|---|---|---|---|---|---|---|---|---|
| PL | 0 | ||||||||||
| CR | 1 | 0 | |||||||||
| JV | 4 | 2 | 0 | ||||||||
| PU | 5 | 1 | 1 | 0 | |||||||
| LP | 3 | 1 | 4 | 3 | 0 | ||||||
| CT | 1 | 1 | 1 | 3 | 1 | 0 | |||||
| UF | 5 | 3 | 1 | 5 | 2 | 2 | 0 | ||||
| SW | 2 | 1 | 1 | 3 | 5 | 5 | 1 | 0 | |||
| DV | 1 | 4 | 2 | 3 | 4 | 2 | 3 | 2 | 0 | ||
| CM | 1 | 3 | 4 | 5 | 2 | 5 | 4 | 3 | 3 | 0 | |
| PD | 4 | 3 | 4 | 4 | 3 | 1 | 3 | 1 | 4 | 1 |
Note. PL = Police Liability; CR= Critical Incidents; JV = Juveniles; PU = Public Trust; LP = Law Procedure; CT = Court; UF = Use of Force; SW = Search Warrants; DV = Domestic Violence; CM = Communication; PD = People in Crisis.
As seen in Table 4, the ratings for each pair ranged from 1 (very similar) to 5 (very dissimilar). Note that the competency area paired with itself had a 0 rating to indicate that the pair was in the same competency area. The distribution of the ratings is shown in Table 5. The most frequent rating was very similar (i.e., 31%), and the least frequent was very dissimilar (i.e., 13%). The data in Table 5 showed that ratings covered the entire range of the dissimilarity scale, indicating the potential for a dispersed set of competency areas.
Table 5
Number and Percentage of Ratings for each Pair of Competency Areas (N = 55)
| Rating | n | % |
|---|---|---|
| 1 (very similar) | 17 | 31 |
| 2 | 8 | 15 |
| 3 | 13 | 24 |
| 4 | 10 | 18 |
| 5 (very dissimilar) | 7 | 13 |
| Total | 55 | 100 |
After successfully implementing ALSCAL, the results of the stress and RSQ values for each of the number of dimensions specified are shown in Figure 4. Stress values range from 0 to 1.0, with values closer to 0 representing good fit. Stress values less than or equal to .1 are good; stress values less than or equal to .2 are fair (Giguere, 2006; Kruskal & Wish, 1978). The RSQ values represent the amount of variance accounted for by the model, with values greater than .6 representing an acceptable fit (Myers et al., 2017).
Figure 4
Stress and RSQ by Number of Dimensions
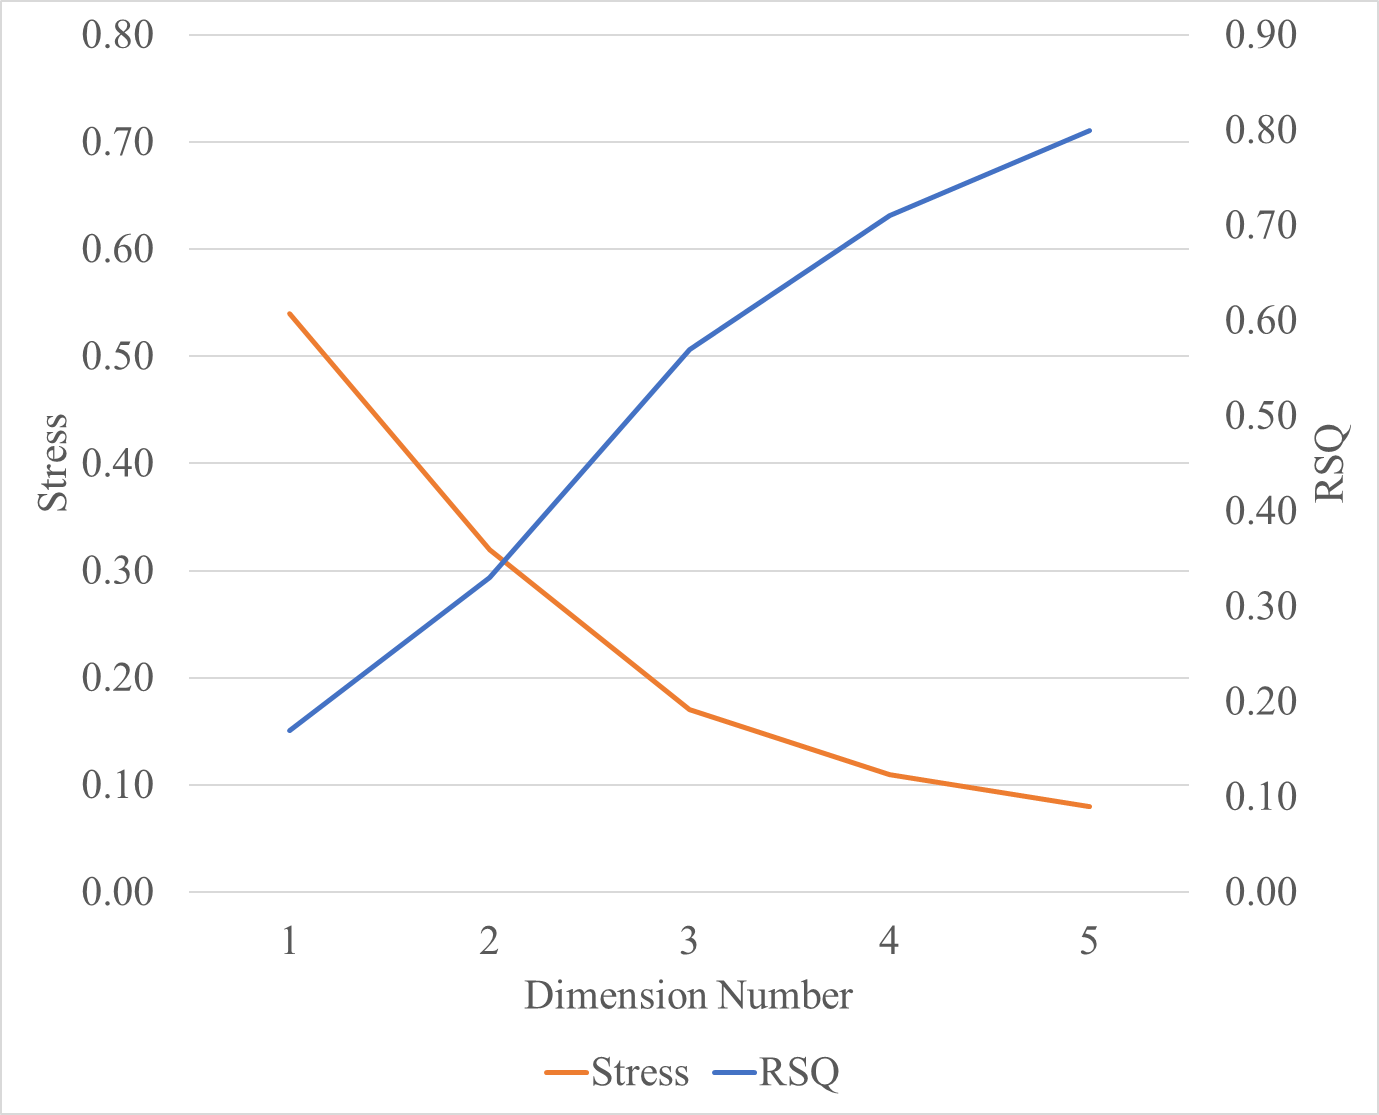
Note. Figure 4 demonstrates that the MDS analysis comparing stress and RSQ indicated strongly across two dimensions.
As shown in Figure 4, the decrease in RSQ (the proportion of variance in the scaled data explained by the distances) did not show significant improvement beyond three dimensions. While a higher RSQ is better, the gains in precision diminish after three dimensions. Therefore, two or three dimensions were considered viable for the MDS solution. Both were presented to the experts, and the two-dimensional solution was preferred after discussion. This choice was made because the experts could more effectively justify the placement of competency areas along two dimensions, whereas the three-dimensional solution was more challenging to interpret.
Once the competencies were arranged along the two dimensions, representing the scaled distances between them, four clusters of closely related competency areas emerged, as illustrated in Figure 5. Cluster A shows Public Trust toward the higher, positive end of the vertical dimension and Juveniles and Use of Force slightly below the middle of the vertical dimension, but all toward the negative end with similar levels with respect to the horizontal dimension. Cluster B represents three competency areas at similar, higher (i.e., positive) levels on the vertical dimension and shows a range of values from negative to positive on the horizontal dimension. Cluster C shows competency areas at high levels on the horizontal dimension and moderate levels on the vertical dimension. Finally, Cluster D shows low levels on the vertical dimension with moderate levels on the horizontal dimension. The clusters roughly outline a quadrant pattern.
Figure 5
Two-Dimensional Solution of Competency Areas with Four Clusters
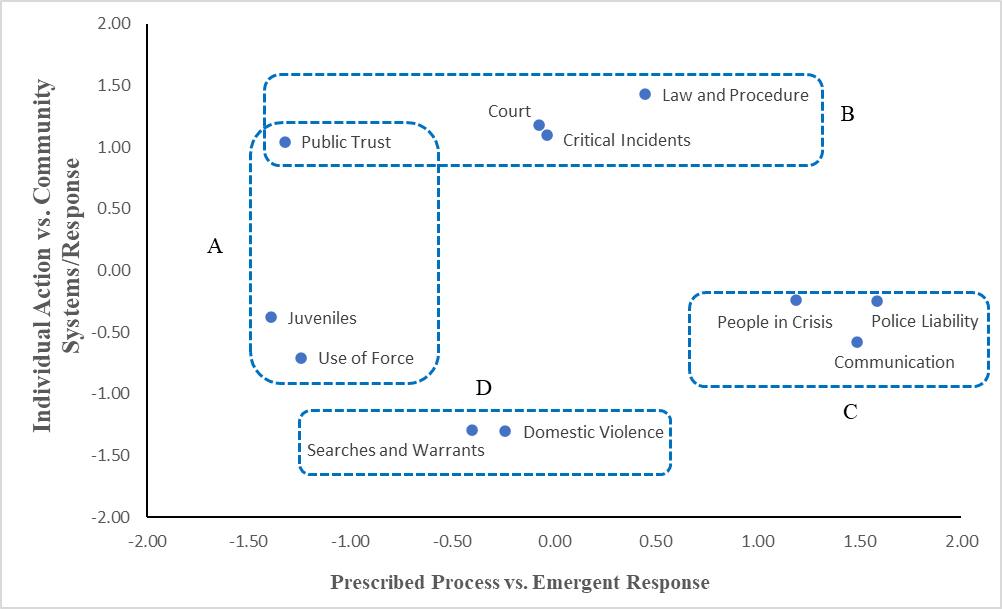
Note. Figure 5 shows the initial plots of competencies based on the MDS analysis across two dimensions (x and y).
Figure 5 provides information to address the research question, “How can experts use MDS to support their thinking in the curriculum-design process?” The map shows the clusters of competency areas from MDS based on the raters’ initial judgments, suggesting that the raters implicitly represented the competency areas across two dimensions. At the same time, it was not clear precisely what these dimensions represented. While the MDS method provided us with clear groupings of competencies, we needed to test whether these groupings offered the instructors meaningful pedagogical or instructional design value. Therefore, we conducted conversations with LEO-TC educator experts to unpack and refine the MDS cluster results. The following section details each step and team insights of Design Cycle 2, which documents the process of making a meaningful map.
Following a structured process, the design team derived a competency map schema through iterative rounds of dialogue, mapping, discussion, and reconciliation of multiple perspectives. Design Cycle 2 comprises three activities: (a) identifying axes and forming quadrants, (c) plotting competencies, and (c) drawing boundaries and labeling neighborhoods.
After the MDS analysis, the design team determined that two dimensions were most meaningful. Through several discussions, the team iteratively developed themes for these dimensions: the first dimension (horizontal axis) was prescribed process vs. emergent response of law officers, and the second dimension (vertical axis) was individual action vs. community systems/response. To clarify these axes in the curriculum context, designers facilitated a discussion with SMEs to create a heuristic description for each quadrant.
The horizontal dimension on one end of the continuum (i.e., left) represents prescribed competencies that are rule-governed behaviors learned through repetition involving practice and application. On the other side of the continuum (i.e., right), the competencies are emergent and represent activities and actions in uncommon situations that a law-enforcement professional must effectively execute but in unique, special (i.e., uncommon) situations and circumstances.
The vertical continuum represents the public/community systems level involved in the officers’ duties. The lower dimension represents competencies related to individual action. These competencies represent inward-facing actions related to law-enforcement professionals’ individual behaviors. This dimension’s upper placement represents outward-facing actions dependent on other legal systems (i.e., Court) and competencies that affect the public (i.e., Community Systems/Response) whom law enforcement is meant to serve.
Based on these preliminary findings through the scaling analysis, as shown in Figure 6, a four-quadrant map canvas was adopted to place competencies in relation to each other: (a) public and prescribed, (b) public and emergent, (c) individual and prescribed, and (d) individual and emergent. The two dimensions supported/confirmed prior curricular characteristics described by LEO-TC experts throughout the exploration process but in a concrete and consistent manner.
Figure 6
Mapping Scheme for Law-Enforcement Curriculum Informed by the MDS Results
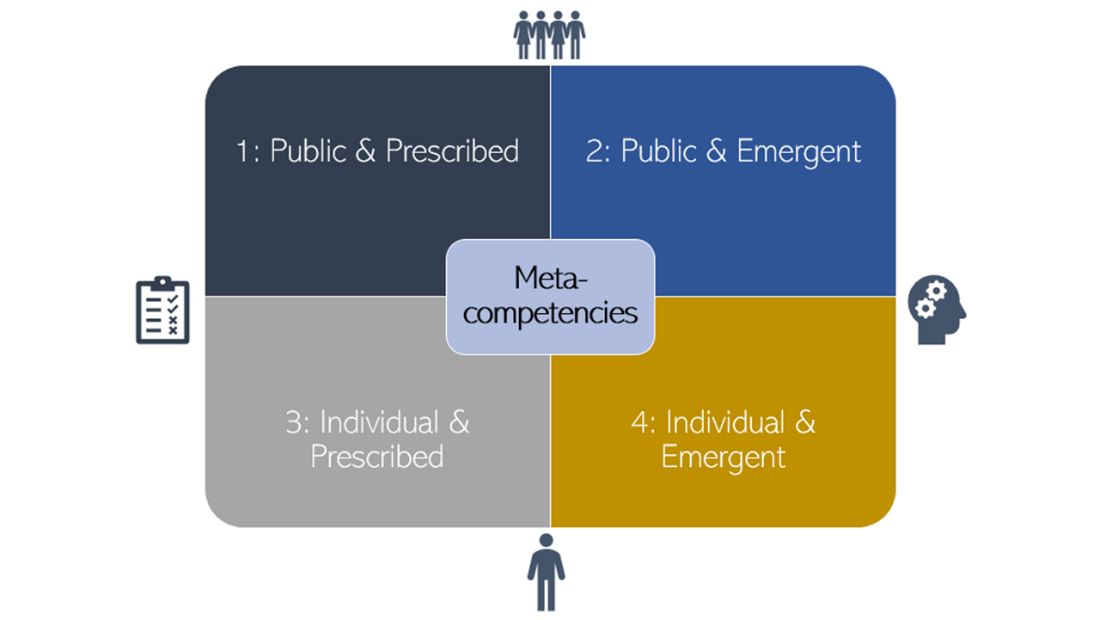
Note. Figure 6 illustrates that the MDS analysis revealed two clear dimensions. Organizing the competencies into quadrants highlights spectrums of activities: from public to individual (y-axis) and from prescribed to emergent processes (x-axis). The central position suggests A possible third dimension, representing meta-competencies that SMEs found relevant across all quadrants.
Figure 6 then helps answer the question, “How can experts use MDS to support their thinking in the curriculum-design process?” MDS can support a framework for understanding the relational quality among competency areas. Identifying axes and forming quadrants was one way the SMEs used the MDS process to yield the essential dimensions determined by the quantifiable residual difference between data points and dimension lines of regression and by SME perspective on subjective interpretability.
The next step was to place all 36 competencies in the quadrants and in relation to each other. Initially, the researchers used the competencies definitions and learning objectives as criteria to place the competencies across the quadrants. These were iteratively reworked and negotiated with the LEO-TC experts. The experts used the location of the competency areas along each dimension to assist them in deriving the continuum represented along each dimension.
Each competency placement involved discussion, negotiation, and meaning-making as the placement was relational, with neighboring competencies influencing their position in all directions. Four competencies—Public Trust, Critical Thinking, Communication, and Officer Safety—were challenging to place because they fit into every quadrant and represented deeper foundational skills. As shown in Figure 7, the design team identified these as meta-competencies and placed them at the center, suggesting a potential third dimension hinted at in the initial MDS analysis.
After the competencies had been placed, as shown in Figure 7, our SMEs guided drawing boundaries to create groupings of “neighborhoods” or themed competency categories. As shown in the maps, competency neighborhoods extend beyond and across quadrants. These four neighborhood clusters are labeled Public and Community, Use of Force and Physical Ability, Law and Procedure, and the Meta-competencies, which operate at a different assessment and skill level. As the largest neighborhood, Law and Procedure could be further organized into four sub-neighborhoods. The final version of the competency neighborhood map makes visible to stakeholders how the curriculum developers (our SMEs and raters) intended the competencies as clusters of knowledge, skills, and abilities to work together relationally.
Figure 7
Drawing Neighborhoods
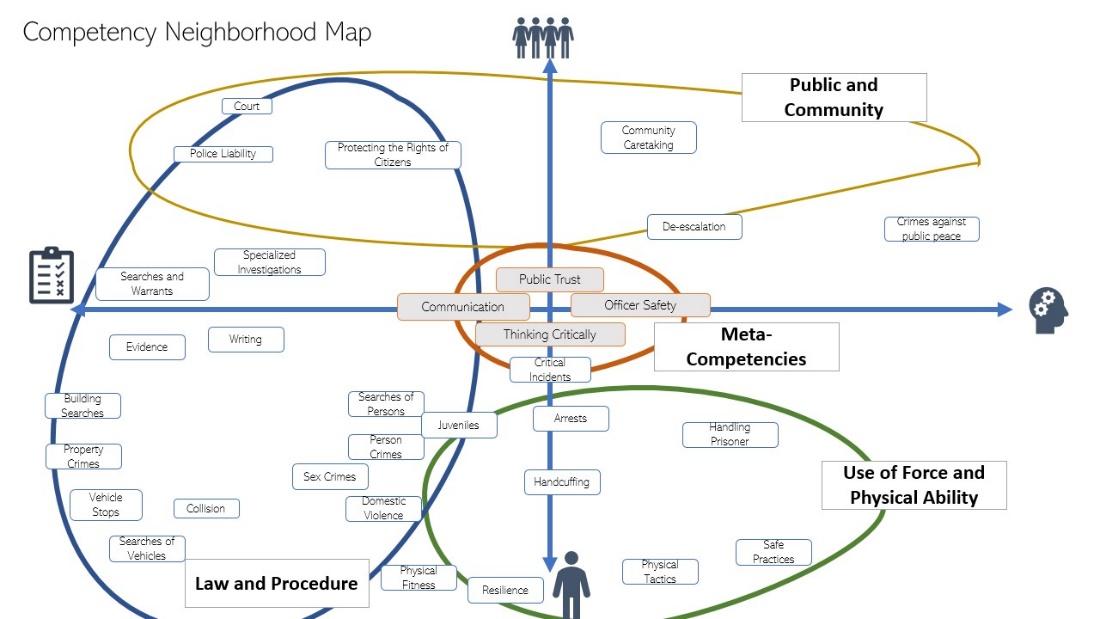
Note. Figure 7 is organized by a quadrant structure (Dimensions 1: Emergent-prescribed, and Dimension 2: Public- individual) and across multidimensional neighborhood clusters: Public and Community, Use of Force and Physical Ability, Law and Procedure, and Meta-competencies.
In addition to the final map, the design team created a table (Appendix A) that lists the competencies by neighborhood. Although the table uses a traditional grid format, it complemented the map to provide clarity for stakeholders. The final competency neighborhood map validated the MDS findings and SME expertise, translating them into a concrete representation. MDS methodology proved valuable for organizing and understanding competencies, such as through the two-dimensional quadrant structure. The design process was enriched by integrating MDS with extensive designer-expert collaboration, enhancing the neighborhood competency clusters beyond the preliminary MDS results.
Competencies represent tightly coupled knowledge, skills, abilities, and behaviors. Understanding the relation between and across competencies is important to drive impactful training and assessment. We began this article by interrogating how to map curriculum through competencies as the building blocks of curriculum. The MDS method proved helpful for analyzing competencies and produced artifacts that inform the curriculum mapping. We return to research questions to organize the discussion.
The fundamental basis for the development of our maps was expert judgment. Experts used the MDS to confirm their curricular judgments and develop a framework for future curriculum construction and decision-making. A key element in our competency maps was the collaborative deliberation process used in MDS development, which relies on expert judgment developed through practice. Designers used MDS methods to plot competencies into mathematical-based data points to distill essential features and test logic. Using these renderings, instructional designers triangulated the findings and SMEs’ discussions into a concrete map. We offer that the map represents a more durable form of analysis and communication of the competencies and, therefore, the curriculum. Furthermore, the map represents both an analytical process and a product.
The process for such mapping consists of four analytical design moves:
Designers can apply MDS-related analytical steps—plotting, meaning-making, negotiating, and bounding—in both deductive and inductive ways. Even without a psychometrician, this qualitative approach helps instructional designers and SMEs develop a shared vision and vocabulary for competencies and curriculum needs. Using a qualitative and iterative design approach with MDS results, we created a competency neighborhood map that supports analysis from multiple perspectives. Facilitated conversations using the map helped IDs and SMEs develop rationales, establish clusters, enhance coherence, and refine relationships.
For example, compare the previous Figures 5 and 7 which are set side-by-side in Figure 8 and highlight the development of the competency map from the initial one emerging from MDS analysis (Map A) and the final map resulting from iterations of facilitated conversation with the raters (Map B). Map A depicts the initial MDS clusters, providing a heuristic frame that structured SME thinking. However, it is important to note that plotted points were not static but moved as SMEs negotiated their criteria and logic. Therefore, comparing the initial cluster MDS with the final map is useful. Specifically, we draw attention to how some competencies shifted from the initial clusters produced mathematically from MDS and the final plotting across the canvas. For example, Juveniles moved up and to the right from the initial plot, while People in Crisis–De-escalation remained in a similar position. These shifts were achieved through qualitative methods and may have also been accounted for quantitively if more time and SMEs were available.
Figure 8
Development of Competency Map
Map A: Initial MDS plot Map B: Final Competency Neighborhood

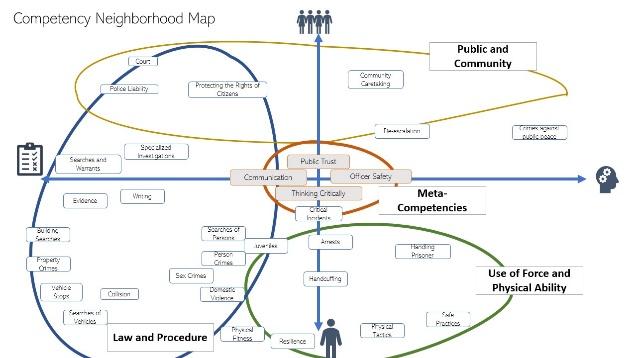
Note. As a reminder, Figure 8 compares Map A- the Initial MDS spatial output created at the beginning of the design process (Figure 2), with Map B- the final competency neighborhood map (Figure 7).
The difficulty of placing four competencies spurred new categories and criteria. For example, both SMEs and IDs agreed that Communication and Public Trust could easily be placed in all four quadrants. Therefore, they were elevated to meta-competencies. Creating another category offered space for other interpretations and more precise distinctions. For example, Police Liability and Juveniles moved across axes from the initial cluster to the final neighborhood. What drove the shift may have been more like/dissimilar competencies refinement of criteria. While in this case, MDS was used at the end of a curricular cycle only after competencies had already been developed and organized to some extent, it could also be used at the beginning or during the development of competencies.
Mapping competency neighborhoods provides valuable insights for instruction and assessment. By defining boundaries, the research team could grasp the complexity and interdependence of competencies. CBE requires detailed and ongoing assessment to ensure students have mastered competencies. Mastery demands time, resources, expertise, and the development of reliable assessment tools that genuinely measure competence. Competency neighborhoods support the development of complex, competency-based assessments and integrated professional development for LEOs in several ways. First, learners must navigate diverse problem-solving strategies. Neighborhood mapping may support the development of multiple authentic assessment approaches by providing the alignment evidence and prescriptive–descriptive cycle needed to develop competencies and instructional sequencing. Competencies are not isolated entities but rather are interdependent. Recognizing competencies’ relational nature, we can gain valuable insights into how different skills and knowledge areas interact and contribute to overall performance.
Understanding the relationality of competencies through mapping methods (both quantitively and qualitatively) is crucial for assessment purposes because it provides a more holistic and accurate picture of an individual’s abilities and skills. Furthermore, understanding the relationships between competencies provides a more valid measure of an individual’s capabilities. One outcome of this understanding is relational assessments, which capture the complexity of real-world tasks and situations where multiple competencies are often required simultaneously. This approach allows a more accurate evaluation of a person’s ability to integrate and apply skills effectively.
Identifying and forming competency neighborhoods allowed LEO-TC experts to make implicit connections explicit between knowledge, skills, abilities, and the practice field. The visual structure allowed LEO-TC to frame other curricula they were developing, such as continuing professional. Furthermore, mapping may support the specialization or personalization of professional development, depending on future career pathways or the needs of the officers’ community or context. LEO-TC faculty noted that more advanced and continuing LEO-TC professional development would focus on more emergent and public-facing competencies in the future (i.e., a shift toward the upper-right quadrant in Figure 6). LEO-TC leadership valued competency neighborhood maps because they made the curriculum understandable to nonexperts, including the wider public and policymakers. Given the increased level of scrutiny and public discourse around law-enforcement behavior and training, LEO-TC faculty must be able to clearly communicate their curriculum in terms that public stakeholders can easily interpret. This bridge between technical psychometric methods and learning-design practice holds great promise for CBE’s more rigorous methodological development.
A key challenge in applying MDS to curricular mapping is selecting a subset of competencies for the rater-comparison scaling process. We chose 11 of 36 competencies to ensure a range of closely related and distinct data points across all key content sections. This strategic selection aimed to make the resulting dimensions and clusters closely approximate the entire landscape of competencies.
Navigating the complexities of competency mapping involves balancing different approaches. Extensive scaling and comparisons require significant effort from SMEs and frequent revisions of preliminary axes and rationales. This method offers detailed analysis, quantitative focus, and intricate visualizations, which are valuable for comprehensive program evaluations. In contrast, using a smaller subset of competencies with provisional axes suits new program development, where competencies are still evolving. Scaling MDS to include more competencies and dimensions results in more detailed maps, which can complicate visualization and comprehension. Choosing the right approach depends on the specific needs and dynamics of the mapping process, and exploring ways to refine maps with more competencies and dimensions is crucial for broader applications. One practical approach to aid experts in naming dimensions and clusters is to capture the themes raters considered when making dissimilarity ratings. This approach involves surveying raters on the themes associated with pairs of competency areas. Correlating this theme information with MDS dimensions helps inform the labeling of dimensions and the formation of neighborhood clusters.
This design case study applied MDS, a psychometric technique, to develop comprehensive competency maps that go beyond traditional grid forms. The study aimed to create methodologically rich competency neighborhood maps. Furthermore, we hoped to create curriculum maps that stakeholders can easily understand and use. Organizing and understanding the relationality between competencies supported intentional content sequencing, multiple mastery paths, and assessment development. The study tested the utility of MDS for organizing competencies and explored the design and communication implications of making this method accessible to learning designers and curriculum developers. The study contributes to learning and curriculum mapping theory, practice, and methods through interdisciplinary collaboration, advancing CBE research and practice.
Table A1
Law Enforcement Officer (LEO) Training Curriculum Competencies Organized by Neighborhood
| Public and Community | Use of Force and Physical Ability | Law and Procedure | Meta-competencies | |||
|---|---|---|---|---|---|---|
| Investigations and Searches a (people) | Investigations and Searches a (materials) | Law and procedure a | Warrants and evidence a | |||
| Crimes Against Public Peace | Arrests | Juveniles | Building Searches | Protecting the rights of citizens | Searches and warrants | Public trust |
| Community Caretaking | Handling Prisoners | Person Crimes | Controlled Substances | Court | Evidence | Communication |
| People in Crisis | Safe practices | Domestic Violence | Searches of Vehicles | Police Liability | Specialized Investigations | Officer Safety |
| Community Relations | Physical Tactics | Searches of Persons | Property Crimes | Writing | Thinking Critically | |
| Police Liability | Resilience | Sex Crimes | Vehicle Stops | |||
| Court | Physical fitness | Collision | ||||
| Protecting the Rights of Citizens | Handcuffing | |||||
| Writing | ||||||
| Critical incidents | ||||||
| De-escalation | ||||||
| Column 1 | Column 2 |
|---|---|
| 1, 1 | 1, 2 |