Identifying K–12 students who need support is essential for schools that aim to provide timely and effective interventions. The increased use of student performance data has accelerated the adoption of Early Warning Systems (EWS) designed to detect off-track patterns through key “ABC” indicators of attendance, behavior, and course performance (Balfanz et al., 2007; Balfanz & Byrnes, 2019). These indicators remain reliable predictors of disengagement, helping educators proactively address student challenges by providing timely alerts and structured data reports that inform instructional and intervention strategies.
Despite widespread adoption, gains in student outcomes remain uneven. Prediction has advanced more than guidance on how to change student trajectories. Identifying students through rankings offers little insight into why they struggle or what support might help (Balfanz & Byrnes, 2019). Even with accurate alerts, schools often face challenges coordinating timely and sustained responses because of limited capacity, fragmented systems, and competing demands.
The central issue concerns how data are interpreted and enacted. Data use is shaped by teachers’ expertise, school norms, and available analytic support (Coburn & Turner, 2011; Breiter & Light, 2006). Dashboards and predictive reports often provide extensive information without the scaffolds needed to convert patterns into strategies. Teachers frequently feel uncertain when comparing trends or selecting next steps, especially when multiple data streams must be integrated under tight time constraints (Decabooter et al., 2025; Datnow & Hubbard, 2016). As a result, the data alerts often produce fragmented or delayed responses, leaving students without timely support and allowing absenteeism or course failure to intensify (Marsh, 2012).
Bridging the gap between early identification and effective intervention demands more than access to data; it calls for systems that actively support educator inquiry. Teachers require systems that are not only timely and responsive but that also foster professional agency, enabling them to formulate, refine, and pursue their own questions about student performance, and connect insights to pedagogical action. However, most current platforms prioritize data delivery over sensemaking and provide little scaffolding for the reasoning needed to move from observation to intervention. Without such supports, even accurate warnings often lead to scattered actions and missed opportunities to redirect student trajectories.
Large language model (LLM)–based conversational agents have shown utility in domains such as tutoring and administrative assistance, yet their role in supporting teacher-driven data inquiry remains underdeveloped. Within early warning workflows, LLM-powered systems may serve as dynamic partners that translate complex data environments into actionable insight and empower timely, targeted educational response.
To address this gap, the present study introduces EdVise, an AI powered conversation agent designed to assist teachers. EdVise streamlines data interpretation and recommends evidence-based interventions aligned with student needs. This paper describes the system’s design features and presents a two-level evaluation focused on user response satisfaction evaluation and response quality evaluation to guide future development and classroom implementation. This study addresses the following research questions: 1) How do educators evaluate their satisfaction with EdVise's responses at the item level across different types of authentic student success team queries? 2) How do educators evaluate EdVise’s response quality, and what major dimensions characterize that evaluation?
The system architecture includes two primary components: the Front-End Interaction Workflows, which guide educators through analytic reasoning and planning tasks, and the Back-End Intelligence Engine, which powers retrieval, reasoning, and adaptation.
EdVise’s interface supports two core types of educator interactions. The first centers on data analysis and interpretation, which allows teachers to examine early warning indicators such as attendance, behavior, and course performance. Through this pathway, educators can request trend summaries, subgroup comparisons, and risk-flag reviews to understand how students or groups are progressing. The second interaction focuses on intervention planning, where users can request or transition into targeted supports. In this pathway, the system generates tailored recommendations that draw on evidence-based strategies aligned with the student’s academic, behavioral, or social‑emotional needs. Together, these two interactions enable both exploratory data sense-making and structured decision support.
Figure 1
EdVise System Architecture
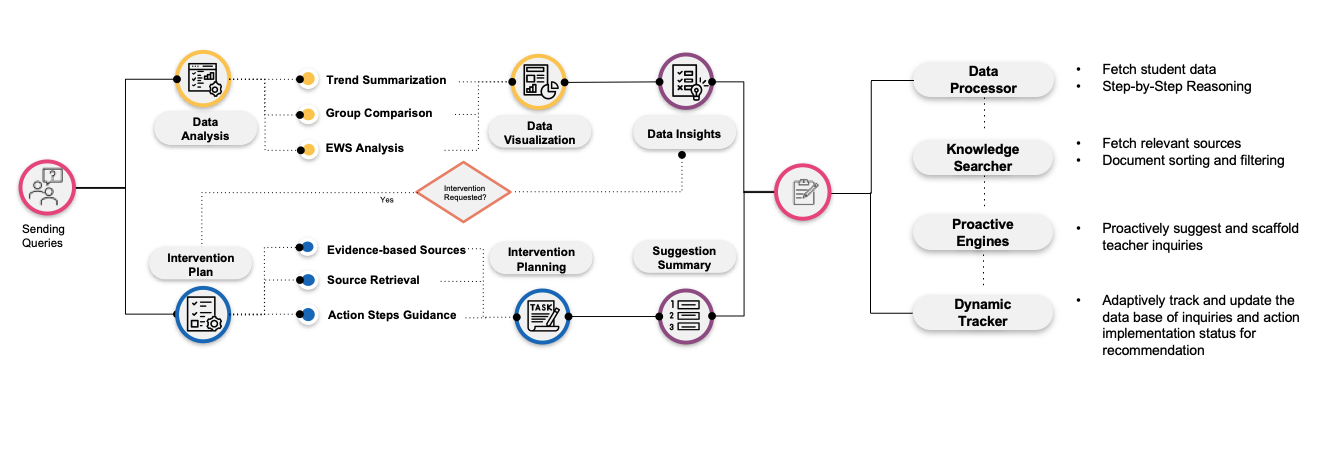
EdVise is designed to operate through four core capacities, each supported by a dedicated engine within its back-end infrastructure. First, the Data Processor retrieves and interprets student records to align responses with educator queries. It ensures that outputs are grounded in available data by applying structured reasoning to indicators such as attendance, behavior, and course performance. Second, the Knowledge Searcher locates and filters relevant intervention resources. It draws from a curated collection of evidence-based practices to provide actionable recommendations that educators can implement with confidence. The third capacity is supported by the Proactive Engine, which is designed to anticipate additional questions or complementary data views that might extend a teacher’s inquiry. For example, when a user asks about behavioral concerns, the system may suggest reviewing academic patterns or social-emotional trends that often co-occur. This anticipatory scaffolding aims to deepen sensemaking and expand teachers’ analytic reach. The fourth capacity is planned through the Dynamic Tracker, which will monitor previous queries, record follow-up actions, and maintain continuity across sessions. It is intended to support ongoing inquiry by prompting revisits to unresolved issues or surfacing prior recommendations that may require further attention. At the time of this study, only the Data Processor and Knowledge Searcher are fully implemented, while the Proactive Engine and Dynamic Tracker remain in development as part of EdVise’s future enhancement roadmap.
The pilot testing evaluation involved 11 participants from the internal research team, including education professionals with experience working with educational data and supporting student success initiatives in school settings. Participants each completed a two-hour session structured around a guided walkthrough and think-aloud evaluation. This study used a two-level evaluation framework to examine EdVise’s prototype performance. The first level, response satisfaction evaluation, focused on participants’ satisfaction with individual responses during interaction. Participants rated the satisfaction at item-level on a three-point scale and recorded brief notes about when responses were helpful or fell short. This process allowed us to capture situated reasoning by observing how users acted upon responses in the context. The second level, response quality evaluation, examined the qualities educators attended to when judging system responses. The review process was initially guided by three dimensions adapted from Ren et al. (2022): accuracy, relevancy, and clarity. A qualitative synthesis of field notes from related design documentation was then conducted to expand this framework to include scaffolding and workflow support. The definition can be found in Appendix 2.
The evaluation was conducted when participants received a response for each query. Teacher queries spanned four primary types: EWS-related analyses, Non-EWS-related analyses, strategic action planning, and guidance-seeking (see Appendix 1).
EWS-related queries comprised nearly half of the dataset (43 of 93) and received an overall mean satisfaction rating of 2.66. Within this category, EWS-integrated queries performed best (M = 2.76), especially when EdVise identified overlapping risks or generated profiles using multiple EWS and social-emotional indicators. Attendance-only (M = 2.46) and course performance queries (M = 2.45) showed more variable performance, particularly for longitudinal questions or comparisons that depended on consistent labels across datasets. Overall, EdVise performed well in structured EWS profiling, with performance becoming less consistent when data labels or historical formatting were less standardized.
Non-EWS queries received a similar overall mean satisfaction rating (M = 2.60). Subgroup analyses were generally handled well (M = 2.75), especially when variables were clearly labeled and aligned with survey fields. In contrast, general data exploration received more mixed ratings (M = 2.45). EdVise performed reliably in file summaries and basic descriptive statistics, but was less consistent in tasks involving data cleaning, ID matching, or cross-dataset comparisons. These results suggest that EdVise was well suited to straightforward exploratory tasks, while more nuanced exploration benefited from clearer variable definitions and more targeted prompts.
Action-planning queries received a slightly lower average rating (M = 2.46) but offered useful insight into EdVise’s decision-support role. Ratings were higher for group-specific brainstorming (M = 2.56) and communication support (M = 2.83), suggesting that the system was most helpful when prompts were concrete. Performance was less developed when the task required synthesizing multiple data points into a targeted intervention plan without explicit guidance, pointing to the value of more structured prompt templates for support recommendations.
Although limited in number, guidance-seeking queries highlighted an important area for future development. These queries often emerged when users were unsure how to frame effective prompts, suggesting that EdVise could play a stronger role in scaffolding educator inquiry through more proactive and context-aware support.
Educators’ evaluation of EdVise’s response quality was characterized across five dimensions: accuracy, relevancy, clarity, scaffolding, and workflow support. A detailed summary is available here. We highlight the major patterns below.
Accuracy emerged as a relative strength, although this performance was more robust in some conditions than others. At the subdimension level, data alignment, visualization correctness, and logical consistency were generally strong when EdVise worked with clearly structured attendance, behavior, grade, SEL, or subgroup data. However, analytical appropriateness was somewhat less consistent when prompts were broad, field names were inconsistent, or category labels were unclear. In these cases, the system was less dependable in selecting the right variables, comparisons, or student groups. This suggests that EdVise performed well in structured analytic conditions, while remaining more sensitive to ambiguity in both prompts and datasets.
Relevancy was generally positive in terms of fit to identified problem, evidence alignment, and situational appropriateness. EdVise usually addressed the central issue raised in a query and its recommendations often reflected recognizable student-support practices. The area that would benefit most from further refinement was actionability. Users frequently needed additional prompting to turn broadly appropriate recommendations into teacher-ready next steps. In other words, the system was often able to suggest what might help, but was less developed in specifying how that help could be implemented in practice.
Clarity was also somewhat uneven across subdimensions. Query interpretation clarity and explanation structure were generally solid, indicating that EdVise usually understood the task and presented responses in an organized way. However, terminology simplicity and justification transparency were less consistent. Some responses used technical phrasing that did not align well with educator everyday language, and some recommendations did not fully explain why a particular pattern mattered or why a suggested action fit the case. As a result, responses could be readable without always being fully transparent or decision-ready.
The two dimensions that extended beyond the original rubric highlighted areas where additional support would be especially valuable. Scaffolding emerged as important because participants often needed support not only in receiving answers, but also in shaping the inquiry itself. At the subdimension level, inquiry scaffolding was still developing when users were unsure how to formulate effective prompts, and action-planning scaffolding was less developed when users tried to move from broad ideas to specific intervention steps. Although user-driven flexibility was a positive sign, since participants did pursue subgroup-specific and locally relevant questions, the system still placed much of the burden for prompt refinement and planning progression on the user.
Workflow support was the dimension most clearly associated with opportunities for continued improvement. Areas such as data onboarding, data integration, workflow continuity, and output usability showed greater room for refinement. Participants wanted stronger support for understanding uploaded files, linking records across data sources, retaining work across sessions, and producing outputs that were easier to share or reuse. These concerns suggest that response quality, in practice, depended not only on the content of the answer, but also on whether the surrounding workflow reduced friction.
This study examined EdVise’s prototype performance in the context of student success team tasks. The findings suggest that EdVise shows strong promise as an educator-facing support tool for data sensemaking, particularly when queries are well structured and grounded in clearly defined indicators, groups, or goals. The system performed especially well in integrated EWS analyses, subgroup comparisons, descriptive summaries, and communication-support tasks, indicating its potential to assist educators in making sense of student data and generating actionable ideas. Response quality findings suggest that future development should strengthen support for prompt formulation, more detailed intervention planning, data onboarding, and sustained workflow continuity across sessions. Overall, EdVise shows meaningful potential, yet continued development will be essential for classroom-ready impact.
Appendix 1
Response Satisfaction Evaluation Results
Types | Subtypes | n | N | Example Questions | Mean Rating score |
EWS Related Analysis | Attendance - only | 13 | 43 | 2.46 | |
A1 – Longitudinal Attendance Patterns | 1 | Can you tell me how my students attendance changes throughout the school year? (i.e.. are more students absent at the beginning, middle or end of the year?) | 2.00 | ||
A2 – Single-Group / Cohort Attendance | 4 | Can you tell me students’ attendance in grade 6 | 2.25 | ||
A3 – Multi-Group / Class Comparisons | 5 | I want to know the average daily attendance (ADA) for students in S’s classes. Can you average their ADA data by class? | 2.60 | ||
A4 – Attendance Definitions / Thresholds | 3 | What threshold did you use for chronic absence? | 3.00 | ||
Behavior - only | 2 | 3.00 | |||
B2 - Behavior Issues in related to other factors | 1 | Do students who have a higher rate of tardies to class have any correlation to major behaviors for the 24–25 year? | 3.00 | ||
B2 - Behavior Profile Comparison | 1 | Looking at the major behaviors data and using other datapoints, what can you tell me about students who have major behaviors vs. no major behaviors? | 3.00 | ||
Course Performance and Assessment - only | 11 | 2.45 | |||
C1 – Cross-Measure Achievement Comparisons | 3 | Can you tell me how the data for students who have CMAS ELA scores in the "Does not meet" and "Partially Met" performance levels, compare to their i-ready reading scale scores? | 2.33 | ||
C2 – Growth Analysis | 3 | Can you be more specific - how much growth? How many grew, vs. stayed within 10 points of their original score, and how many dropped? | 2.67 | ||
C3 – Group-Level Achievement Insights | 3 | Let's verify the data. How many students have performance levels of Did not yet meet expectations and Partially Met Expectations for 23-24 CMAS ela? | 2.00 | ||
C4 – Visualization Requests | 2 | Can you create a graph that demonstrates this? | 3.00 | ||
EWS Combined | 17 | 2.76 | |||
D1 – Risk Intersection Analysis | 3 | Let’s see how behavior and academic risks overlap. | 3.00 | ||
D2 – EWS Student Identification & Risk Flagging | 3 | Can it identify a list of students who are struggling? failing a course, or grade below 60% or attendance below 90% | 2.33 | ||
D3 – EWS/SEL-Based Cluster Profiling | 5 | Percent of at-risk students below average on all three SEL factors | 3.00 | ||
D4 – Visualization Requests | 6 | Visualize SEL results for suspended + failing vs average student. | 2.67 | ||
Non- EWS Related | Non-EWS/SEL Subgroup and Comparison Analysis | 12 | 32 | 2.75 | |
E1 – Demographic Grouping | 4 | Using the demographic data to create groupings, can you give me a review of how these groups responded to some of the questions in the mid-year survey? | 2.75 | ||
E2 – Condition-defined subgroup | 8 | For this group of students with a higher rate of tardies to class, does their student survey look any different from students who do NOT have a high rate of tardies to class? | 2.75 | ||
General Data Exploration | 20 | 2.45 | |||
F1 – File / structure exploration | 4 | What can you tell me about data in the uploaded file? | 3.00 | ||
F2 – Descriptive summaries | 3 | Can you convert that analysis into 2-3 bullet points, as if I was sharing this analysis in a presentation? | 3.00 | ||
F3 – Comparative summaries | 3 | I want to look at them all and do some comparisons. Can you tell me about the mid-year survey data? | 1.67 | ||
F4 – Specific-field exploration | 7 | Can you show me S’s 7th Grade Pre-Algebra classes by period and the demographic breakdown of each of those classes? | 2.43 | ||
F5 - Data Matching and Cleaning | 3 | Can you give me the list of student names that do not have matching identifiers? | 2.00 | ||
Action Planning | Strategic action brainstorming | 16 | 16 | 2.44 | |
G1- Group-specific action brainstorming | 9 | Brainstorm interventions for at-risk students below average on ≥1 SEL factor. | 2.50 | ||
G2 - Student-specific action brainstorming | 1 | I want to create a set of intervention for 3 students in their ELA classes | 2.00 | ||
G3 - Communication support | 6 | Can you give me a sample biweekly communication plan with parents? | 2.83 | ||
Seeking Guidance | 2 | 2 | 1.50 | ||
Total | 93 | 2.66 |
Appendix 2
Response Quality Evaluation Dimensions
Dimension | Sub-Metric | Definition | Evidence |
Accuracy | A1. Data Alignment | The summary statistics or comparisons matched the underlying dataset. | Values reflect the true attendance counts, behavior incidents, grade levels, SEL fields, or subgroup distributions. |
A2. Analytical Appropriateness | The analysis selected the right variables, comparisons, and student groups. | Use of correct grouping, appropriate comparisons, and logical selection of indicators based on the query. | |
A3. Visualization Correctness | The generated charts correctly represent the data. | Proper scaling, correct axis labels, correct categories, correct frequency counts. | |
A4. Logical Consistency | The interpretation logically follows from the analytics or visualization. | No contradictions, no incorrect claims, no mismatched narrative. | |
Relevancy | R1. Fit to Identified Problem | The response addressed the specific issue raised in the query. | Strategies match the identified pattern such as chronic absence, disengagement, low performance, or subgroup need. |
R2. Evidence Alignment | The recommended strategies match known practices in student support. | Interventions reflect established supports such as attendance, behavioral, academic, or SEL-oriented practices. | |
R3. Situational Appropriateness | The recommendations feel feasible and appropriate for the scenario. | No generic or irrelevant strategies. Clear alignment to the student profile, subgroup, or school context. | |
R4. Actionability | The suggestion provides a next step a teacher can implement. | Step-based guidance, teacher-ready actions, and minimal reliance on vague statements. | |
Clarity | C1. Query Interpretation Clarity | How clearly EdVise understood what the teacher was asking. | Correct identification of the task, appropriate restating of intent, and limited misinterpretation. |
C2. Explanation Structure | The explanation is well organized and easy to follow. | Clear steps, coherent paragraph structure, and no unnecessary rambling. | |
C3. Terminology Simplicity | The system avoids technical language that teachers would not typically use. | Use of plain language, accessible phrasing, and limited statistical jargon. | |
C4. Justification Transparency | EdVise explains why a pattern matters or why an intervention fits. | Explicit connection between the data trend and the suggested interpretation or action. | |
Scaffolding | S1. Inquiry Scaffolding | The system helps educators formulate, refine, or extend productive questions. | Prompt suggestions, clarification support, or follow-up guidance that helps users move from vague curiosity to analyzable questions. |
S2. Action-Planning Scaffolding | The system helps educators move from broad ideas to more structured implementation planning. | Support for timing, grouping, communication, sequencing, or other details needed to turn recommendations into plans. | |
S3. User-Driven Flexibility | The system supports educator-driven exploration beyond the default workflow. | Ability to adjust thresholds, pursue subgroup-specific questions, refine requests iteratively, and follow locally relevant lines of inquiry. | |
Workflow Support | W1. Data Onboarding Support | The system helps users understand and begin working with uploaded data. | File structure summaries, variable recognition, column clarification, and support for initial setup. |
W2. Data Integration Support | The system supports analysis across multiple files or linked data sources. | Matching student IDs, cross-file linking, combined analysis, or support for fragmented datasets. | |
W3. Workflow Continuity | The system supports ongoing work across multiple steps or sessions. | Retaining prior analyses, enabling follow-up work, and supporting longitudinal or iterative team use. | |
W4. Output Usability | The outputs are usable for communication, sharing, or follow-up action. | Shareable summaries, presentation-ready charts, exportable materials, and outputs that fit educator workflow needs. |