Mobile learning is the most studied educational technology of the last decade, with a 269% increase in publications between 2011 to 2021 (Dubé & Wen, 2022). Krouska et al. (2022) found that mobile learning can have a significant and positive impact on students’ academic performance, given that the mobile app is well-designed. Zerihun et al. (2012) argue that users’ affective learning experience plays a key role in measuring the effectiveness of a teaching activity. Thus, measuring students’ affective experience of mobile learning can provide insights into creating well-designed mobile learning apps.
Mobile app developers and researchers study app reviews in app stores (e.g., Google Play) to gain insights into users’ experience with mobile learning (Montazami et al., 2022a,b). Several studies (Gao et al., 2018; Genc-Nayebi & Abran, 2017; Guzman & Maalej, 2014) argue that app reviews represent the users' ‘voices’ and can contribute to the development and design of applications. However, leveraging user reviews to infer user experience is not straightforward, as they consist of both quantitative ratings (e.g., 4/5 stars) and qualitative text.
Sentiment analysis could be used to study the text of user reviews. It employs natural language processing (NLP) to ascertain the emotional tone (positive, negative, or neutral) of digital text by converting it into numerical data, enabling the use of machine learning algorithms for predictions and inferences (Tunca et al., 2023). Thus, sentiment analysis could be used to code the polarity of user reviews to identify the viewpoint or opinion expressed in the text (Jebaseel & Kirubakaran, 2012). After doing so, users' affective experience from text reviews could be compared with their quantitative ratings of the app (e.g., 4/5 stars). It is unclear if such an approach would be informative. Analysis of user reviews from a popular mobile learning app could provide a starting point.
Duolingo is the world’s most downloaded mobile learning app, with 500+ million learners worldwide (Blanco, 2022). 30 million new users began using Duolingo only two months into the COVID-19 pandemic (Blanco, 2020). Thus, users’ reviews for Duolingo could give insights into the popular mobile learning trend. This study uses sentiment analysis of Duolingo user reviews to determine whether text in user reviews can provide insights into users’ mobile learning experience as indicated by the alignment of the emotional tones in the text with their quantitative ratings of the app.
RQ1. What is the distribution of emotional arguments across different rating levels?
H1. Users who give higher ratings express more positive emotions in the text reviews
H2. Users who give higher ratings express fewer negative emotions in the text reviews
H3. Users who give higher ratings express higher compound sentiment scores in the text reviews
RQ2. To what extent do emotional arguments in the text reviews account for differences in user ratings?
We collected 25,000 Duolingo app reviews from the Google Play App Store using Python with the package google-play-scraper 1.2.4, targeting English language users from the United States. The dataset includes review ID, text review content, rating score, number of thumbs up per review, and app version. The rating score has five levels (1 = lowest). 5,000 reviews were collected for each rating level. Reviews were excluded if: 1) emoji only; 2) no text review; 3) mixed language use. After screening, 24,391 reviews remained.
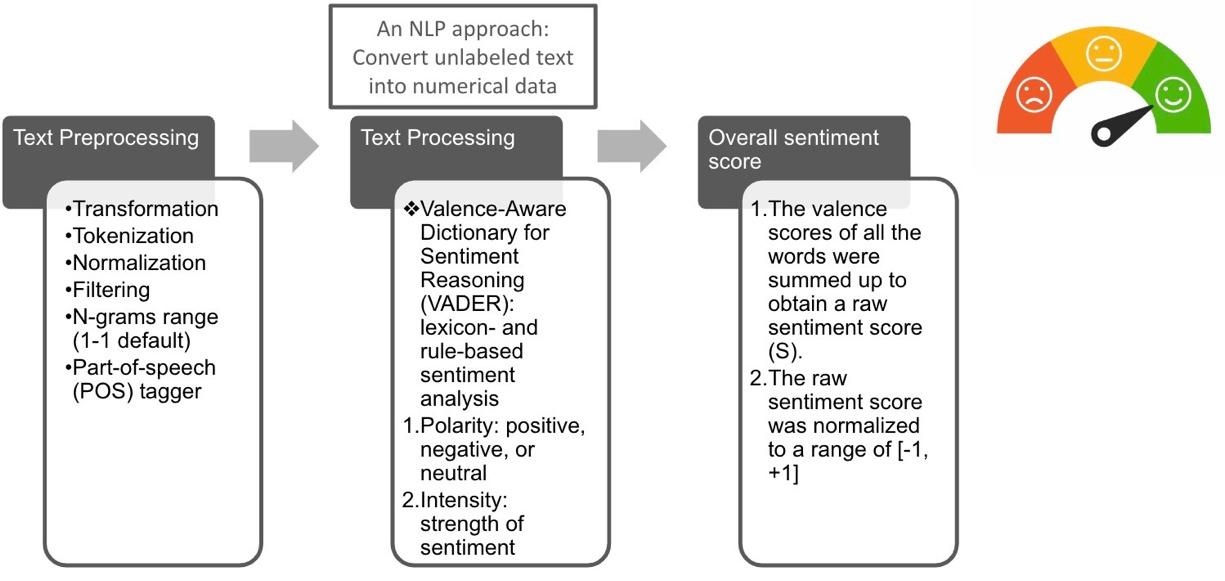
Figure 1 shows the sentiment analysis procedure. We used the valence-aware dictionary for sentiment reasoning (VADER) tool to quantify sentiment scores from users' comments and classify them as positive, negative, or neutral, as well as create a compound score. The compound scores gauge user review positivity or negativity, following a four-step process. First, the text underwent tokenization. Second, sentiment intensity scores were assigned to each word using a sentiment lexicon. Third, valence scores of all words were summed to derive a raw sentiment score. Finally, the raw sentiment score was normalized to a range of –1 (extreme negativity) to +1 (extreme positivity), indicating overall sentiment polarity. The formula illustrates the computation; specifically, C refers to the compound score while S refers to raw sentiment scores:
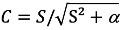
Figure 1
Sentiment Analysis Procedure
RQ1. Table 1 provides the distribution of emotional tones and compound across different rating levels. Also, Figure 2 shows the distribution of emotional arguments.
Table 1
An Example of a Table for the AECT Proceedings
Positive | Negative | Neutral | Compound | |||||
|---|---|---|---|---|---|---|---|---|
Mean | SD | Mean | SD | Mean | SD | Mean | SD | |
Score 1 (n = 4,818) | 0.19 | 0.27 | 0.13 | 0.18 | 0.68 | 0.27 | 0.02 | 0.52 |
Score 2 (n = 4,879) | 0.15 | 0.19 | 0.10 | 0.11 | 0.75 | 0.19 | 0.06 | 0.55 |
Score 3 (n = 4,893) | 0.30 | 0.31 | 0.06 | 0.10 | 0.64 | 0.29 | 0.26 | 0.45 |
Score 4 (n = 4,929) | 0.38 | 0.29 | 0.03 | 0.08 | 0.59 | 0.28 | 0.44 | 0.37 |
Score 5 (n = 4,872) | 0.46 | 0.29 | 0.01 | 0.05 | 0.52 | 0.28 | 0.53 | 0.29 |
Total (n = 24,391) | 0.30 | 0.30 | 0.06 | 0.12 | 0.64 | 0.28 | 0.26 | 0.49 |
Figure 2
The Distribution of Emotional Arguments.
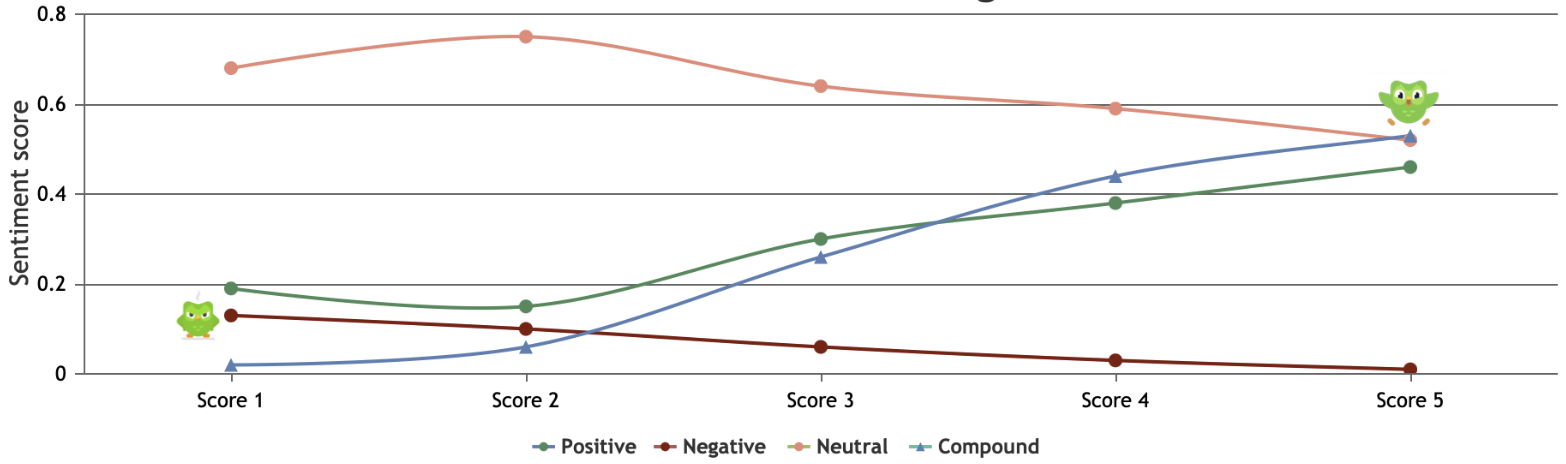
H1. The results confirmed that users who gave higher rating scores expressed more positive emotions in the review content, F (4, 22615.121) = 1,126.001, p = < .001, np2 = .156, with significant differences between each of the rating score groups (ps < .001).
H2. Users who gave higher rating scores expressed lower negative emotions in the review content, F (4, 15126.005) = 878.321, p = < .001, np2 = .127, with significant differences between each of the rating score groups (ps < .001).
H3. Users who gave higher rating scores expressed a higher compound sentiment score in the review content, F (4, 20911.963) = 1,244.429, p = < .001, np2 = .17, with significant differences between each of the rating score groups (ps < .001). Clearly, emotional tones differed by rating score.
RQ2. A 2-step linear regression was run (S1: compound score; S2: positive, negative, neutral scores) to identify the amount of variance in user rating accounted for by emotional scores overall and then the unique contributions of each emotional score type. At S1, compound score alone (β = .41, p < .001) accounted for 16% of variance in user rating, F = 4787.841, p < .001; at S2, compound (β = .19, p < .001) and negative (β = .34, p < .001) scores accounted for 4.7% more variance, R2 = .21, F = 1636.183, p < .001.
The findings indicate a clear relationship between users’ emotional arguments and rating scores. Emotional arguments are key factors impacting users’ ratings and expressing their mobile learning experience, particularly negative ones. Notably, users who gave lower rating scores expressed more neutral emotions, which was unexpected. This finding gives researchers and developers a new sign that these kinds of users are more likely to give lower ratings. On the other hand, these users were more likely to report issues that they experienced and describe the issues in a neutral tone. The reviews with lower rating scores and neutral tone need to be further analyzed in the future.
This study revealed a novel method using sentiment analysis to explore users’ learning experience and feedback, making meaningful contributions to developers to select useful reviews to improve mobile learning more effective. In future work, meaningful comparisons could be made among mobile learning apps based on their text reviews. Overall, this study contributes new methods to evaluate mobile learning tools and gain insights into design differences among mobile learning applications.
This work was partially supported by a SSHRC (435-2021-0612) Insight grant, held by Adam Dubé, in support of Jie Gao’s doctoral studies.