Introduction
Between May and December 2022, researchers from Full Sail University looked at the effects of incorporating a virtual reality (VR) assignment, i.e., an immersive 360° project using Adobe Captivate, into the third week of an Instructional Design (ID) course. This 2022 study noted a small increase in grades and course satisfaction occurred when the instructor incorporated the VR assignment (Meeder & McBride, 2023). Prior to that study, research on VR’s effect on student performance was lacking (Johnson et al., 2019), which prompted researchers to conduct their study in the first place. In the 2022 study, they noticed a slight increase in grades and course satisfaction but wanted to gather more data. Fast forward to January 2023. Researchers continued to gather student data for the next seven months with the VR assignment fully incorporated into the course curriculum. While gathering data for the 2023 research study, researchers also examined student demographic data. This tied into the focus of the AECT 2024 Convention, which emphasized using “technology and the creation of inclusive, equitable, and ethical learning environments…in practical contexts” (AECT, 2024, n.p.). Through the application of this theme onto the 2023 study, more research questions arose regarding VR incorporation into heterogenous classes and its effect on such an environment.
The purpose of this study is to determine whether the demographic makeup of a condensed, four-week, online, higher education ID course and the incorporation of VR into its curriculum affect student performance. In the first three weeks of the course, students engage in learning activities that involve audio, video, and interactive media. In Week 4, students apply best practices and theories learned from the previous three weeks into a final project. The final project is a “video proposal” where students explain how they could incorporate the modalities of audio, video, and interactive media into static exhibits within the Osceola County Welcome Center and History Museum to enhance visitor experiences.
Starting January 2023, researchers continued to gather data on student performance in the course. The researchers used the same research questions from the original 2022 study, which are based on the course learning outcomes.
Does including virtual reality in an online class help students consider designing and delivering instructional content using a variety of software applications?
Can incorporating virtual reality in an online class encourage students to effectively present information and data visually and verbally?
Does using virtual reality in an online class motivate students to better assess the effectiveness of media used in an instructional module?
As stated in the 2022 study, “virtual reality integration into training environments and courses provides numerous benefits to adult learners” (Meeder & McBride, 2023, n.p.). Results from various studies supports the addition of VR in the classroom (Soto et al., 2020). These benefits include increased learner engagement, greater motivation, more support for differentiated learning styles, increased sense of belonging, and more collaboration among peers (Current Virtual Reality Best Practices for the Classroom, n.d.; DELTA, n.d.).
However, a limited number of studies exist examining VR’s effect on heterogenous populations (Peck et al., 2021). One study examining nursing students in virtual learning communities noted, “The differences according to race and ethnicity suggest that as student populations increase in diversity, multimodal methods of learning may help students, regardless of learning style, to flourish” (Fogg, et al., 2013, n.p.). However, the study did not mention VR specifically. In another study involving online learning, ethnicity, and age, researchers indicated the minority status of students had a positive effect on perception of instructor support, but a negative effect on online course satisfaction (Ke & Kwak, 2013). Now, researchers want to continue adding on to this body of knowledge with this 2023 study.
In the 2022 study, researchers used an Action Research (AR) approach of planning, acting, observing, and reflecting on the results generated from a particular project or body of work (Dick, 1999; Zuber-Skerritt, 2002). Researchers chose this methodology for the 2022 study since the Instructional Design and Technology Master’s in Science (IDTMS) program was undergoing a series of course revisions from June to December 2022 (Meeder & McBride, 2023). In the beginning of 2023, the Program Director for the IDTMS program asked instructors to not make any changes to their courses due to accreditation board members reviewing their classes. Therefore, researchers continued to gather qualitative and quantitative data from their students for their 2023 study, but did not institute any cycles of revisions, which are commonly seen in Action Research.
Most of the methods for the 2023 study were the same as the 2022 study, which included comparing past and current grades, examining course evaluation ratings, and distributing open-ended surveys to the enrolled students. The only difference was, instead of student-instructor communication, researchers coded student-student communication from group Zoom sessions.
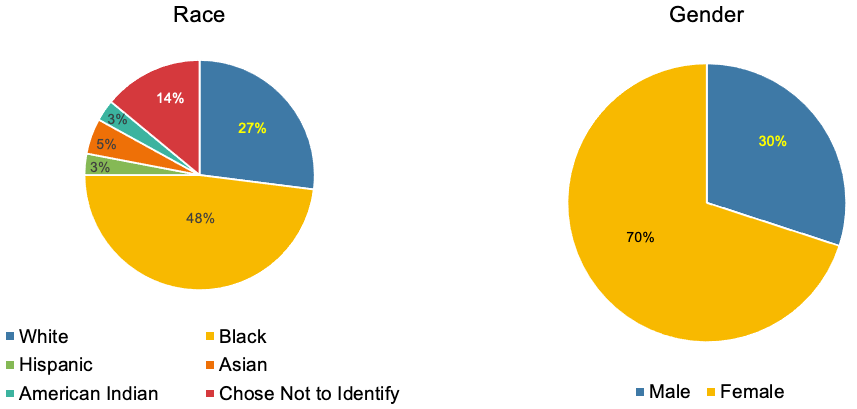
The population of both the 2022 study and this study in 2023 consisted of IDTMS students enrolled in a Digital Media and Learning Applications class at Full Sail. A total of 56 students participated in the 2022 study. Twenty-two of those students were from the IDT574 classes that did not incorporate virtual reality into their third week assignment, and 37 of the students were from the IDT574 classes that incorporated virtual reality into their third week assignment (Meeder & McBride, 2023). Of the 37 students, 27% identified as white, 48% identified as Black, 3% identified as Hispanic, 5% identified as Asian, 3% identified as American Indian, and 14% chose not to identify; 30% of the population identified as male and 70% of the population identified as female (see Figure 1).
Figure 1
2022 Participant Demographics
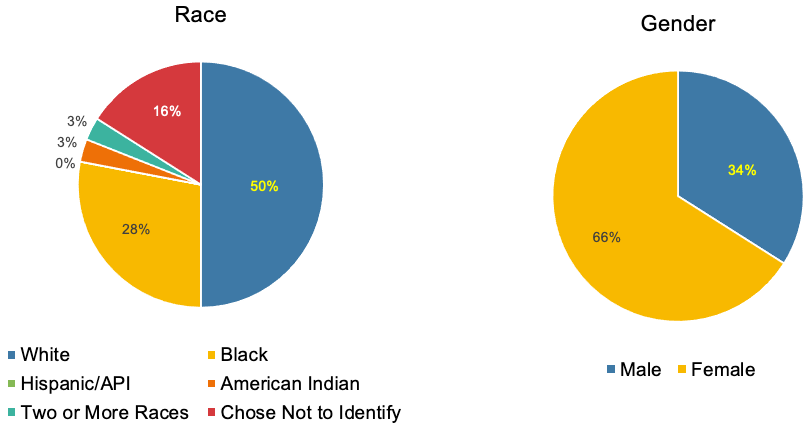
In the 2023 study, a total of 35 students participated. Within that population, 50% identified as white, 28% identified as Black, none identified as Hispanic nor Asian/Pacific Islander, 3% identified as American Indian, 3% identified as two or more races, and 16% chose not to identify; 34% of the population identified as male and 66% of the population identified as female (see Figure 2). Comparing the populations of the 2022 study and the 2023 study, researchers describe the population of the 2022 study as more “heterogenous” than the population of the 2023 study in terms of racial makeup. Both populations remained similar in terms of gender identification.
Figure 2
2023 Participant Demographics
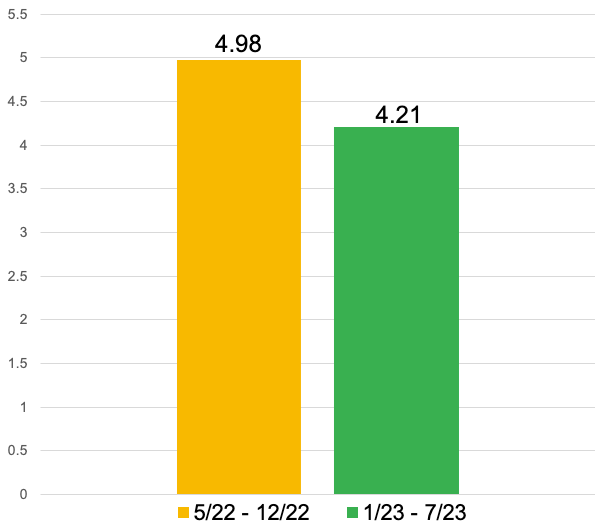
In the 2022 study, researchers compared the IDT574 course student grades before and after VR implementation and noticed a small increase in grades. Similarly, course satisfaction ratings within course evaluations rose slightly (Meeder & McBride, 2023). However, when comparing student grades and course evaluation ratings from the 2023 study with the 2022 study, researchers noticed a decrease in both areas. The average grade, also known as “Mastery of Content,” for the 2022 study participants was 92.59 out of 100, whereas the 2023 study participants had an average grade of 86.18 out of 100 (see Figure 3). Additionally, the 2022 study participants rated their instructor experience an average of 4.98 out of 5, whereas the 2023 study participants rated their instructor experience an average of 4.21 out of 5 (see Figure 4). Similarly, the 2022 study participants rated their overall experience with the class an average of 4.98 out of 5, whereas the 2023 student participants rated their overall experience an average of 4.21 out of 5 (see Figure 5).
Figure 3
Participant Content Mastery
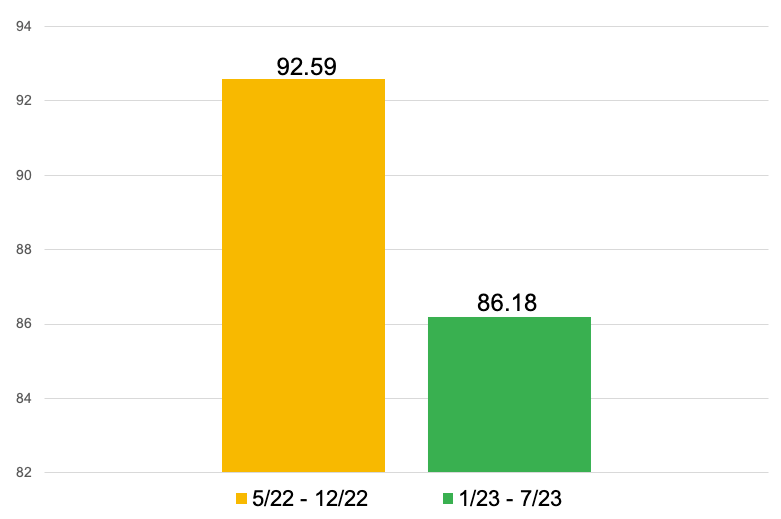
Figure 4
Instructor Rating
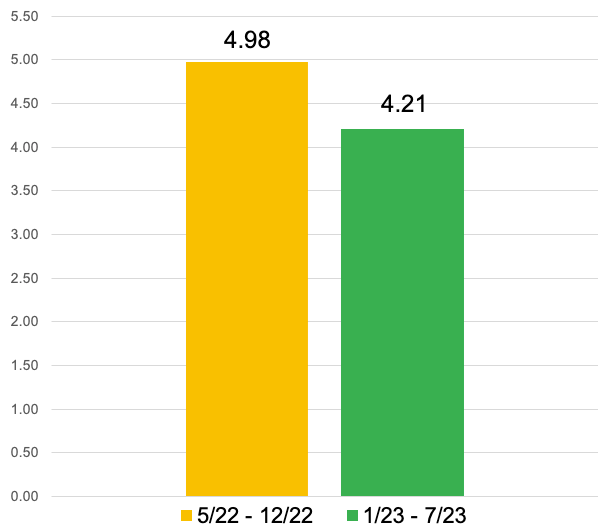
Figure 5
Overall Experience Rating
To analyze qualitative data from student-student communication and open-ended surveys, researchers used constant-comparative method. For qualitative data from surveys and student-student communication in 2023, themes of accessibility, cost, time, cognitive load, self-reflection, frustration, and application to career appeared. Comparably, more positive themes of prior experiences, learning styles, motivation, and inspiration appeared when the 2022 students discussed VR’s effects on their performance in the class (Meeder & McBride, 2023). For instance, a student from the 2023 study stated in a survey, "I feel that VR is not as accessible for everyone and that I will not be able to use this content as quickly as I would like" whereas a student from the 2022 study stated, "I constantly like putting myself into 'other people's shoes' to better understand them and learn about what motivates them. VR [allowed] me to translate that into a product that goes even further into that" (Meeder & McBride, 2023, n.p.). In other words, students in the 2022 study had a more positive view of VR than students in the 2023 study, according to data from the survey.
Others indicated similar feelings during their student-student Zoom sessions in 2023. One student from the 2023 population stated in a Zoom session with fellow classmates, “...felt like kind of like biting off more than I could chew because...learning how to use the tool for the VR portion and finding a way to make it applicable felt like more than a week's worth of work for me, on top of how chaotic this week has been.” In comparison, a student from the 2022 study said in a student-instructor interview, "I would say that I...improved because I never thought about, um, the Virtual Reality part [until] now...Some of those modules [from my workplace]...could be so much more engaging if they actually was having us looking in a virtual reality" (Meeder & McBride, 2023, n.p.). Overall, more positive comments towards VR occurred in the qualitative data from the 2022 study verses the participants in the current 2023 study who were less heterogenous in terms of racial makeup. Similarly, grades decreased between the 2022 students and students from the 2023 study.
The only observable difference between the two groups is their racial makeup. Both groups had similar population size and ratios of gender identification. The 2023 population, which was less heterogeneous than the students from the 2022 study, seemed to perform worse and perceived VR as having a negative effect on their performance. This opened researchers up to the following questions:
How do heterogenous ID classes affect student performance and perceptions towards VR?
Can other factors besides race and gender affect student performance and perceptions towards VR (i.e., socioeconomic status, etc.)?
Does the percentage of students from certain backgrounds embolden them to share or prevent them from sharing their thoughts and feelings about using VR?
Researchers believe more research is needed to explore the connection among performance, VR, and demographic data. Analysis of other demographic factors for future studies can possibly include disability, military background, housing situation, and language. Further research into demographics and VR use in higher education could help influence educational policy and ID practices, enabling instructors to better examine their students’ backgrounds and access to technology before deciding whether to incorporate VR into their classes.