Introduction
The benefits of online learning are widely recognized. However, many students still prefer face-to-face interactions due to a lack of social and teaching presence, delayed responses and encouragement, and feelings of isolation (Bowers & Kumar, 2015; Gray & DiLoreto, 2016). Among these barriers, feelings of isolation are closely tied to the absence of a sense of community among online learners, which social interactions can nurture (Rovai, 2002a). Studies have consistently shown how a strong sense of community positively impacts students’ engagement, increasing learning and satisfaction (Dawson, 2006; Lear et al., 2010; Oliphant & Branch-Mueller, 2016). These studies on the sense of community have primarily focused on structured academic interactions, such as discussion forums. However, informal interactions can also foster a sense of community. Social media serves as a platform to foster interpersonal connections and reduce emotional distance among students (Guy, 2012). Students can express support and share emotions on social media by liking posts or leaving comments (Fernandes & Castro, 2020).
Although there is a growing body of research on the use of social media in education (e.g., Akcaoglu & Lee, 2018; Sánchez et al., 2014), studies specifically examining its role in fostering a sense of community remain limited (Dennen et al., 2020). This study explores the potential of informal social media activities to enhance a sense of community among online learners. The guiding research questions are:
How do students engage with informal Instagram activities in an online learning context?
Does participation in informal Instagram activities relate to students’ social media usage and their perception of using it in education?
Does participation in informal Instagram activities relate to students’ sense of community?
This study occurred in a 12-week online course for undergraduate students at a large state university. From weeks 7 to 9, students were required to make at least two weekly posts on Instagram or the Canvas discussion board. The instructor and TA did not participate, and no specific topics were given; students were directed to share anything of their choice using the class hashtag.
Out of 26 students, 20 participated in the Instagram activity. In week 7, students completed an online survey regarding their social media usage and perception of using it in education. In week 12, they completed another survey to measure their sense of community (Rovai, 2002b), which also included open-ended questions.
The survey results were analyzed using descriptive statistics. Social Network Analysis (SNA) with NodeXL was employed to examine three weeks of student interactions within Instagram, focusing on eight network properties (see Table 1). Additionally, thematic analysis was performed to interpret the responses to the open-ended survey questions.
Table 1
Definition of Network Properties
Property | Definition |
|---|---|
In-degree Centrality | Number of unique incoming edges to a node. |
Out-degree Centrality | Number of unique outgoing edges from a node. |
Betweenness Centrality | Extent to which a node lies on paths between other nodes. |
Closeness Centrality | Inverse of the total shortest path lengths from a node to all reachable nodes. |
Eigenvector Centrality | Importance of a node within a network. |
Geodesic Distance | Shortest path length between two nodes. |
Reciprocity | Likelihood of mutual links between nodes. |
Density | Ratio of existing edges to possible edges in the network |
A total of 20 students participated in the Instagram activity through posting, responding, or liking. Over three weeks, students averaged 2.28 original posts, 1.15 responses, and 7.41 likes per week. While the number of original posts was relatively low, most students actively engaged by liking their classmates’ posts. The Instagram network (see Figure 1) showed a density of 0.53 and an average degree centrality of 10.2. The network is well-connected, as indicated by a reciprocity value of 0.44, meaning approximately 44% of connections were reciprocated through likes or responses.
Figure 1
Social Network in Informal Instagram Community
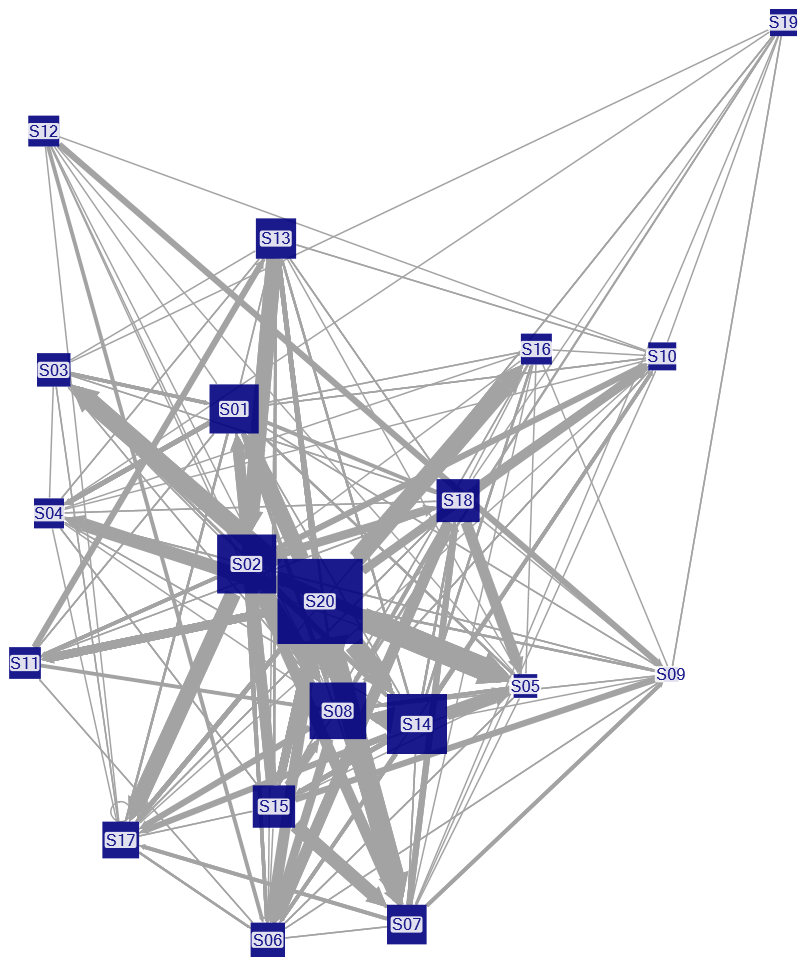
Note. Node size represents total participation (posts, responses, and likes), while edge width reflects the frequency of interactions between nodes.
Eight participants engaged only by liking classmates’ posts without responding. Six students (S01, S02, S08, S14, S18, S20) were the most active participants, with total participation exceeding the group average (M=32.55). These students demonstrated higher out-degree than in-degree values, indicating their strong influence on others. This influence is further supported by their higher betweenness, closeness, and eigenvector centrality scores (see Table 2).
Table 2
Instagram Community Participants’ Network Properties
Students ID | Posts | Responses | Likes | In-Degree | Out-Degree | Betweenness Centrality | Closeness Centrality | Eigenvector Centrality |
|---|---|---|---|---|---|---|---|---|
S01* | 6 | 1 | 36 | 15 | 17 | 9.56 | 0.95 | 0.27 |
S02* | 7 | 7 | 48 | 12 | 17 | 9.56 | 0.95 | 0.27 |
S03 | 6 | 0 | 14 | 7 | 7 | 1.37 | 0.68 | 0.16 |
S04 | 5 | 0 | 11 | 11 | 10 | 4.74 | 0.83 | 0.23 |
S05 | 8 | 0 | 2 | 14 | 2 | 3.22 | 0.79 | 0.22 |
S06 | 5 | 1 | 15 | 11 | 10 | 4.95 | 0.83 | 0.23 |
S07 | 7 | 11 | 10 | 11 | 11 | 4.84 | 0.83 | 0.23 |
S08* | 16 | 3 | 38 | 13 | 16 | 11.01 | 0.95 | 0.27 |
S09 | 4 | 0 | 0 | 13 | 0 | 4.04 | 0.76 | 0.20 |
S10 | 6 | 0 | 8 | 12 | 7 | 5.10 | 0.79 | 0.22 |
S11 | 8 | 4 | 6 | 7 | 6 | 0.00 | 0.63 | 0.14 |
S12 | 5 | 3 | 9 | 0 | 9 | 0.65 | 0.66 | 0.15 |
S13 | 5 | 4 | 20 | 9 | 11 | 2.88 | 0.76 | 0.20 |
S14* | 10 | 3 | 51 | 9 | 16 | 6.74 | 0.91 | 0.26 |
S15 | 8 | 8 | 16 | 12 | 8 | 3.92 | 0.79 | 0.22 |
S16 | 7 | 0 | 10 | 5 | 8 | 1.12 | 0.73 | 0.20 |
S17 | 6 | 0 | 18 | 13 | 11 | 4.55 | 0.83 | 0.25 |
S18* | 6 | 9 | 18 | 14 | 13 | 8.69 | 0.91 | 0.26 |
S19 | 4 | 0 | 9 | 3 | 7 | 1.55 | 0.66 | 0.14 |
S20* | 8 | 15 | 106 | 13 | 18 | 9.51 | 0.95 | 0.27 |
Note. Students in the high participation group, which have a total number of participation (i.e., the combination of posts, responses, and likes) higher than the mean (M=32.55), are marked with an asterisk (*).
In the informal Instagram activity, students in the high participation group (with total participation above the mean) reported higher social media usage (3.75) than those in the low participation group (2.79). However, perceptions of social media use in education and a sense of community, measured at the end of the semester (Week 12), showed no significant differences between the two groups (see Table 3).
Table 3
Comparison Between High and Low Participation Groups
Measures for Comparison | High Participation | Low Participation |
|---|---|---|
1 Social Media Usage Level | 3.75 | 2.79 |
2 Perception of Using Social Media in Education | 3.46 | 3.60 |
3 Sense of Community | 3.15 | 3.01 |
4 In-degree Centrality | 5.67 | 9.14 |
5 Out-degree Centrality | 16.17 | 7.64 |
6 Betweenness Centrality | 29.33 | 5.616 |
7 Closeness Centrality | 0.92 | 0.75 |
8 Eigenvector Centrality | 0.33 | 0.22 |
9 Geodesic Distance | 1.43 | 1.27 |
10 Reciprocity | 0.22 | 0.37 |
11 Density | 0.30 | 0.46 |
Note. Measures 1–9 represent the group averages. Measures 1–3 used a Likert scale ranging from 1 (“Strongly disagree”) to 5 (“Strongly agree”).
Regarding network dynamics, students in the high participation group exhibited higher average out-degree, betweenness, closeness, and eigenvector centrality, indicating they connected with more peers and acted as key bridges within the network. However, students in the low participation group had a higher in-degree centrality (9.14 vs. 5.67), meaning they received more likes and comments on average than those in the high participation group.
As shown in Figures 2 and 3, reciprocity (0.22) and density (0.30) were lower in the high participation group than in the low participation group (reciprocity: 0.37, density: 0.46). While students in the high participation group interacted with a larger number of peers, their engagement was more dispersed, with fewer sustained back-and-forth interactions, resulting in lower reciprocity. This also contributed to lower density, as interactions were spread across the network rather than concentrated within a close-knit network.
In summary, the higher out-degree and betweenness centrality in the high participation group suggests that these students were more engaged in one-way interactions, initiating connections across a broad network rather than fostering mutual exchanges. In contrast, students in the low participation group had fewer but more reciprocal and densely connected interactions, likely forming stronger local connections despite lower overall activity.
Figure 2
High Participation Group (Total participation > Mean)
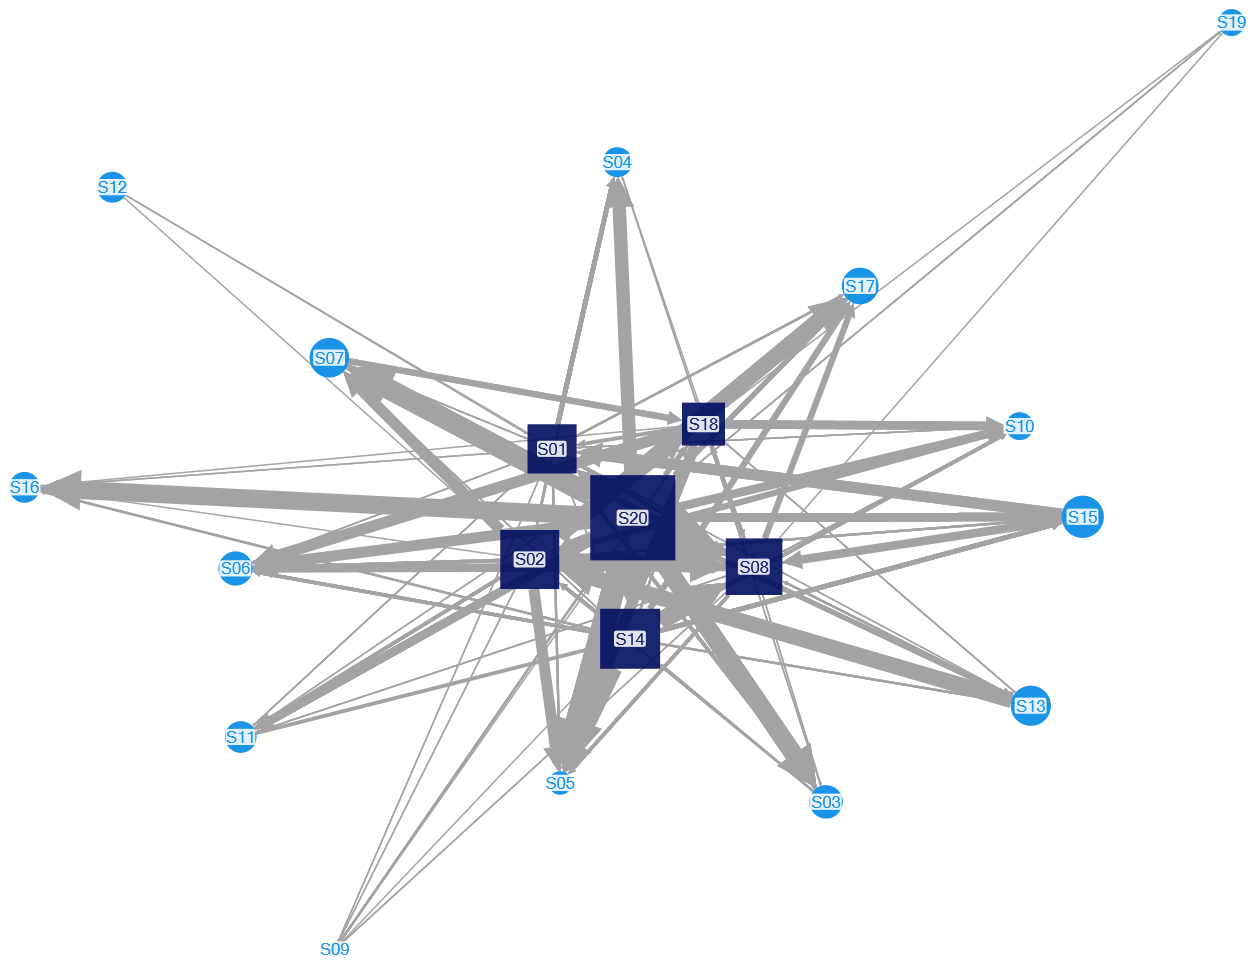
Note. This diagram shows only students connected to the high-participation group (Squares: high-participation, Circles: low-participation).
Figure 3
Low Participation Group (Total participation < Mean)
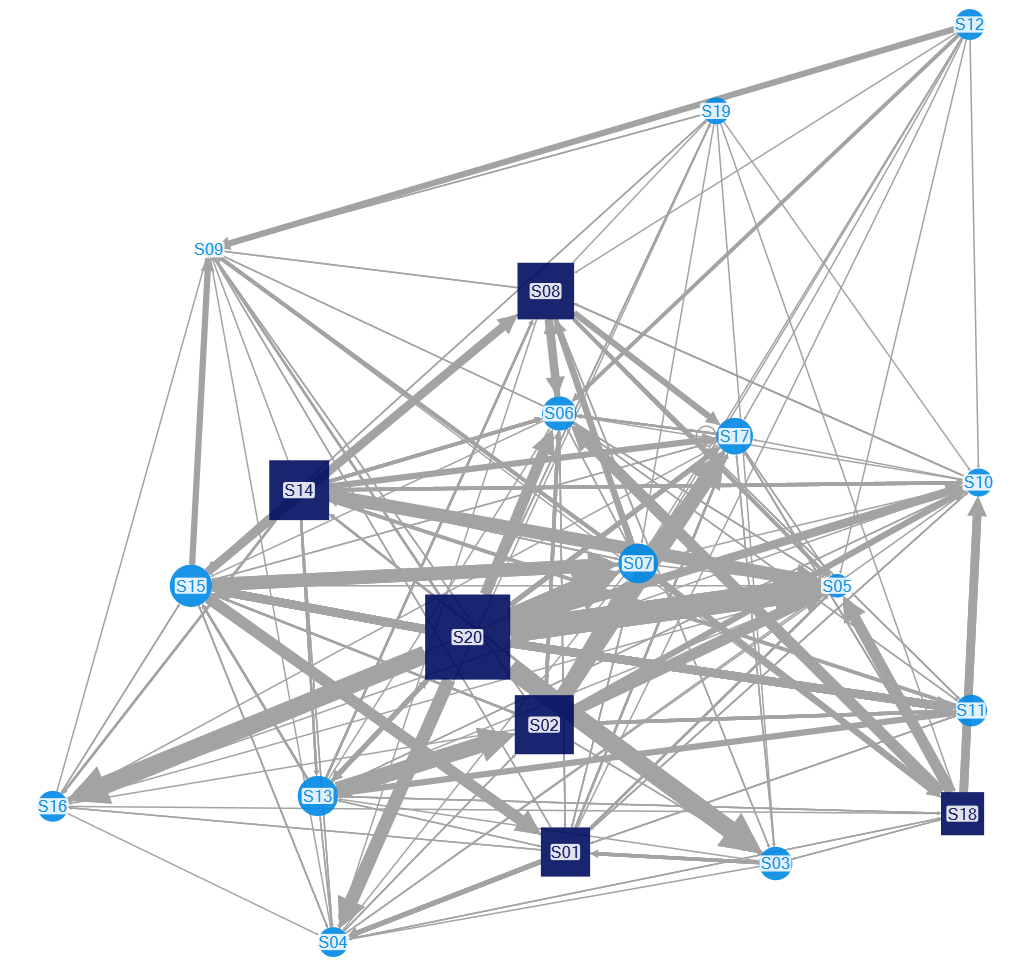
Note. This diagram shows only students connected to the low-participation group (Squares: high-participation, Circles: low-participation).
The open-ended responses revealed mixed opinions; however, most students expressed positive views about the Instagram activities, highlighting how they provided opportunities to connect with classmates on a more personal level. Some students, however, voiced privacy concerns when using social media (see Table 4).
Table 4
Examples of Students’ Open-Ended Responses on Instagram Activities
Attitudes | Open-Ended Responses |
|---|---|
Positive | “I believe Instagram was a good medium for social interaction as much of the class postings did not relate to the course material.” |
Neutral | “Instagram did offer a good window into people's lives, but I can't say I genuinely "know" any of my classmates better as a result of the Instagram activity...It was simply something on my weekly to-do list...” |
Negative | “I am a very busy and somewhat private person, so I didn't share more than was required. I found Instagram to be a distraction from my other daily activities and that was a problem for me.” |
This study explored the potential of informal social media activities to foster a sense of community among online learners. The findings suggest these activities can help build a sense of community in online learning environments. Most students participated by ‘liking’ others’ posts rather than ‘posting’ or ‘commenting.’ While ‘liking’ is a more passive behavior, it reflects students’ attitudes and emotions toward their peers, demonstrating social presence (Kim & Yang, 2017; Shea et al., 2022). These casual and emotional interactions can foster personal connections among classmates and enhance their sense of community. However, instructors should offer social media literacy guidelines for students with privacy concerns to promote responsible and informed use. Future research on informal social media should overcome limitations such as the small sample size and short duration of this study to seek more solid and strong generalizable findings.