Since 2014, the EdHub Library, developed by the University of Missouri’s Network for Educator Effectiveness (NEE), has provided over 500 self-paced activities for K-12 educators, focusing on research-based teaching strategies and the development of classroom observation skills. Educators can navigate topics via the homepage, search engine, or Teacher Indicator sitemaps. The library organizes professional development (PD) materials into a three-level structure, with each module offering three to five independent activities throughout the year. To date, EdHub has supported roughly 38,000 educators in Missouri, Nebraska, Kansas, and internationally, including Vietnam (Leung, 2024a).
The COVID-19 pandemic exacerbated disparities in internet access and high-quality PD, increasing the need for remote teaching and digital tool-focused PD (Kim et al., 2021). Educators prioritized immediate challenges, including technology integration and remote classroom management, with resource selection influenced by local policies (Reich et al., 2020). The pandemic highlighted gaps in educators' technology skills, driving demand for virtual classroom management and online teaching pedagogy (Trust & Whalen, 2020). Heavy workloads and disrupted collaborative learning environments hindered PD participation and peer support, as educators faced unprecedented challenges requiring swift instructional and resource decisions (Hill et al., 2013).
EdHub uses Google Analytics to track user engagement with PD, collecting data on access, location, user type, and time spent, while maintaining privacy. Past research has shown that unusual engagement patterns can indicate behavioral shifts due to external factors, such as policy changes or pandemics (Schildkamp et al., 2020). Given the library's large user base and data, machine learning is more effective than qualitative methods for identifying engagement patterns and irregularities (Aggarwal, 2015; Mao et al., 2024). Machine learning has been vital for EdHub Library in designing and evaluating online educator PD for NEE, including curating emergency preparedness resources (Leung, 2024a), understanding search terms (Leung, 2024b), and personalizing PD for new teachers (Leung, 2025). This study extends these data-informed efforts to analyze educators' engagement with PD during the pandemic.
The Professional Capital Theory offers a framework for analyzing how user engagement with PD has unfolded during the COVID-19 pandemic (Hargreaves & Fullan, 2015). Human capital emphasizes the necessity for educators to rapidly acquire skills in technology integration and online teaching methods, as they pivoted to remote instruction. Social capital was weakened as traditional in-person professional development was disrupted, reducing opportunities for in-person collaboration. Decisional capital faced significant challenges, as educators were required to make quick and informed decisions to adapt to remote learning environments.
This study employs time-series clustering and anomaly detection on web analytics data to examine how educators utilized the EdHub Library during the COVID-19 pandemic. We identify engagement patterns based on accessed pages, locations, dates, and time spent on resources. The study addresses the following research questions: RQ1. What are the general user access characteristics during the pandemic? RQ2. Which professional development materials were detected as regular patterns across locations during the pandemic? RQ3. Which professional development materials were detected as anomalies across locations during the pandemic?
This study used the Python package Tsfresh (Time Series Feature Extraction Based on Scalable Hypothesis Tests) for time-series clustering and anomaly detection to analyze educators' engagement with PD in three parts: (1) exploratory data analysis, (2) cluster pattern recognition, and (3) anomaly or irregular behavior detection. Tsfresh extracts features from noisy time-series data with temporal dependencies while reducing dimensionality (Blue Yonder GmbH, n.d.).
The web analytics data was extracted from the Google Analytics dashboard into Jupyter Notebooks for 10 months, from March 1, 2020, to December 31, 2020. Time-series analyses were conducted using Tsfresh, while Matplotlib was used for visualization (Matplotlib, n.d.). The key variables included Page for tracking the PD resource, City for access locations, Date for date and time of user engagement, and Time On Page for measuring engagement duration in seconds (GA4 Analytics Dimensions and Metrics, n.d.). This selection of variables helped identify educators' regular and irregular engagement with resources over the period of analysis.
In the first part of the study, Tsfresh enabled exploratory data analysis to quantify and visualize educators’ access to PD during the pandemic by identifying the number of unique users across monthly peaks and troughs (high or low points).
In the second part of the study, Tsfresh was applied unsupervised to time-series data, converting it into a structured format for clustering (Blue Yonder GmbH, n.d.). This process identified user engagement patterns related to resources, locations, access dates, and time spent on PD. Using the k-means algorithm, the optimal number of clusters was determined to be eight, with a high silhouette score of 0.9614, indicating well-separated clusters.
Third, the anomaly detection component employed the Isolation Forest model to identify irregular user engagement with PD resources that deviated from expected behaviors identified by the clustering step. The MinimalFCParameters in Tsfresh extracted key statistical measures for the Time On Page variable, including sum, mean, median, minimum, maximum, and standard deviation (Blue Yonder GmbH, n.d.). The model identified 1,465 anomalies across small school districts in Missouri and Fresno, California, including specific PD resources.
The evaluation of cluster pattern recognition involved three main steps: (1) testing the Tsfresh algorithm with k-means models from 0 to 20 to observe differences in cluster outputs; (2) applying the elbow method to determine the ideal number of clusters based on silhouette scores, which range from -1 to +1; and (3) visualizing the clusters in a principal component analysis (PCA) space to assess their formation (Blue Yonder GmbH, n.d.).
RQ1. What are the general user access characteristics during the pandemic?
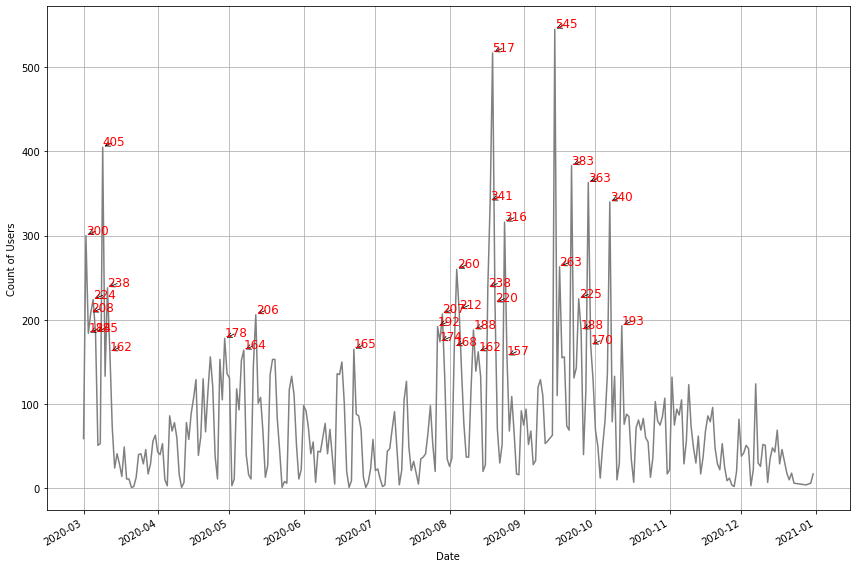
In the exploratory component, Figure 1 shows that the highest usage occurred from August to October 2020, as educators prepared for remote instruction, and during mid-March 2020, when online classroom observation training took place. Unique users ranged from 157 to 545 during the high-activity periods (August–October). In contrast, the lowest usage was noted from April to July 2020 and November to December 2020, with fewer than 206 unique users.
Figure 1
Peaks in User Engagement From March 1, 2020, Through December 31, 2020
RQ2. Which professional development materials were detected as regular patterns across locations during the pandemic?
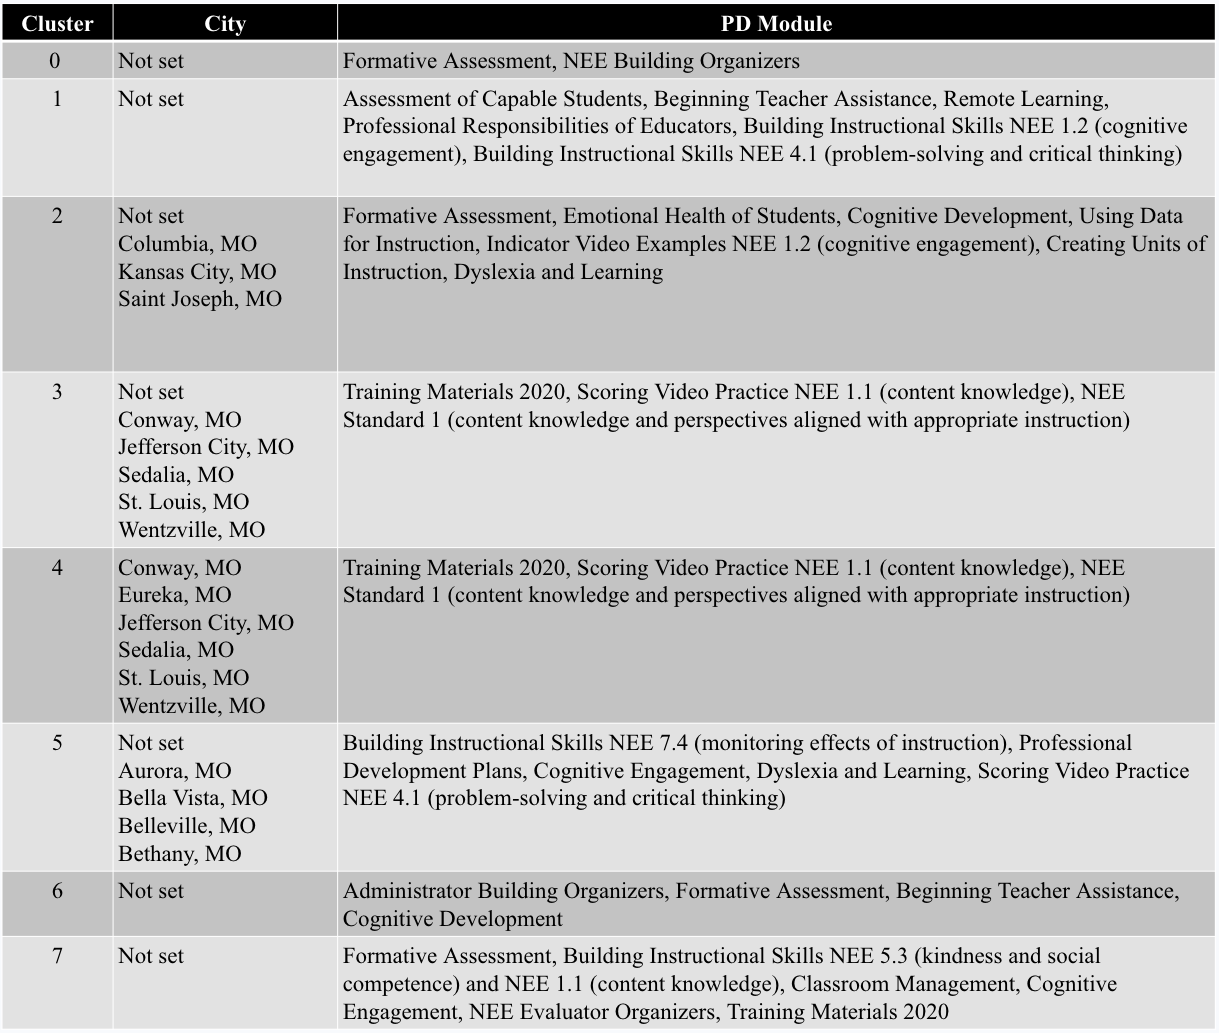
In the cluster pattern recognition section, Figure 2 displays eight clusters of small school districts based on the City variable, with access to the Administrator, Units of Instruction, and Remote Learning modules. Many clusters also included a "not set" location, as educators often used proxies and virtual private networks (VPNs) for privacy purposes. Clusters 0 and 1 are denser, indicating similar data points, while Clusters 3 and 7 are more spread out, suggesting higher variability. Clusters nearer to the origin have lower PCA component values, while those farther out may contain outliers in the Time On Page variable. Figure 3 details the characteristics of the clusters, and Figure 4 summarizes the grouping patterns of access to PD resources and cities.
Figure 2
Clusters of PD Resources in PCA Space
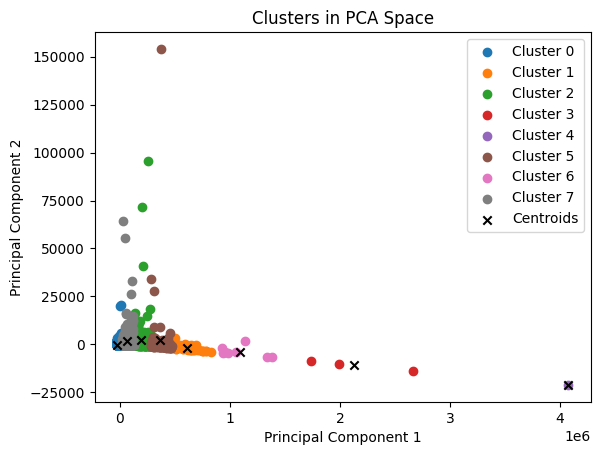
Figure 3
General Characteristics of Clusters
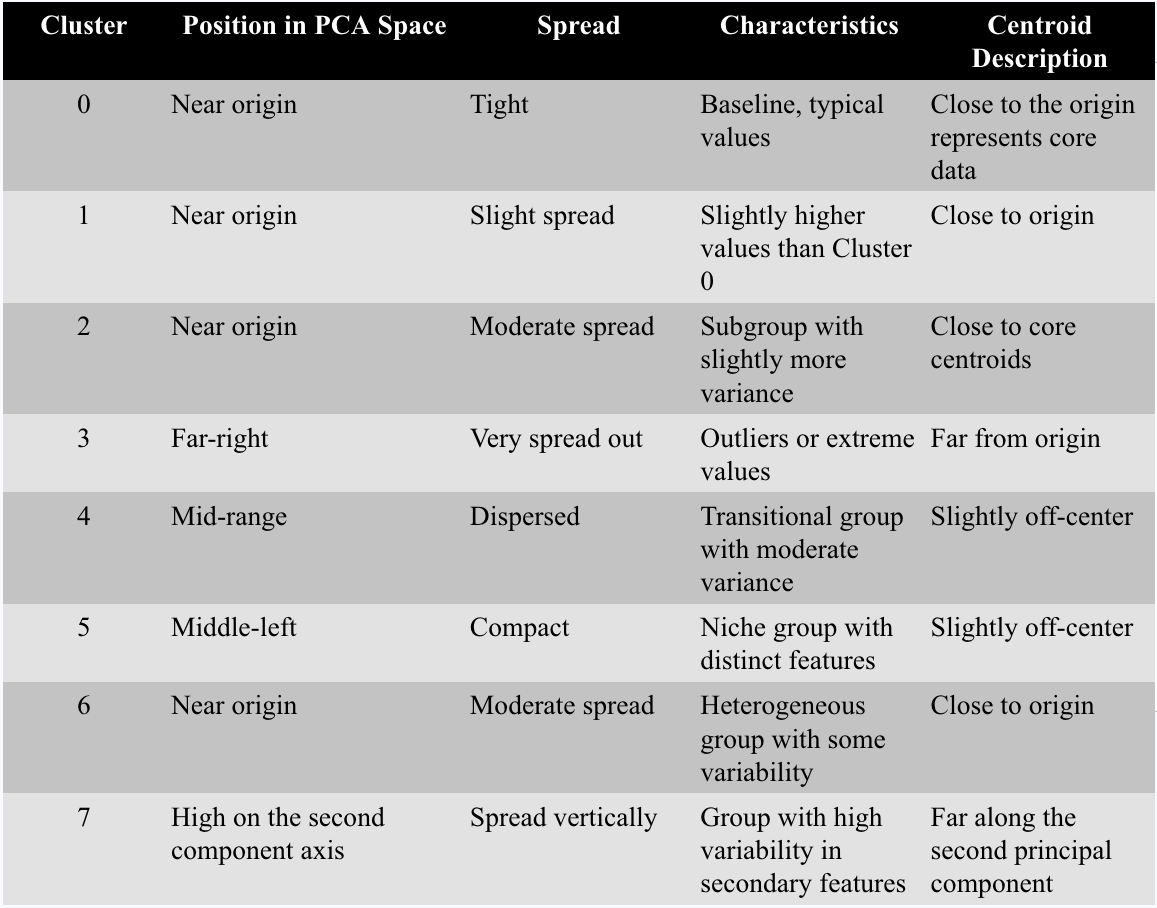
Figure 4
Description of Pages and Locations from Clusters
RQ3. Which professional development materials were detected as anomalies across locations during the pandemic?
Figure 5 illustrates the anomaly detection of City, Page, and Time On Page variables. For instance, Ste. Genevieve, MO, had the longest Time On Page at 3,196 seconds (about 53 minutes), and Fresno, CA's Classroom Observation Training had a Time On Page of 2,470 seconds (about 41 minutes).
Figure 5
Detected Anomalies by Median Time On Page Variable (in seconds)
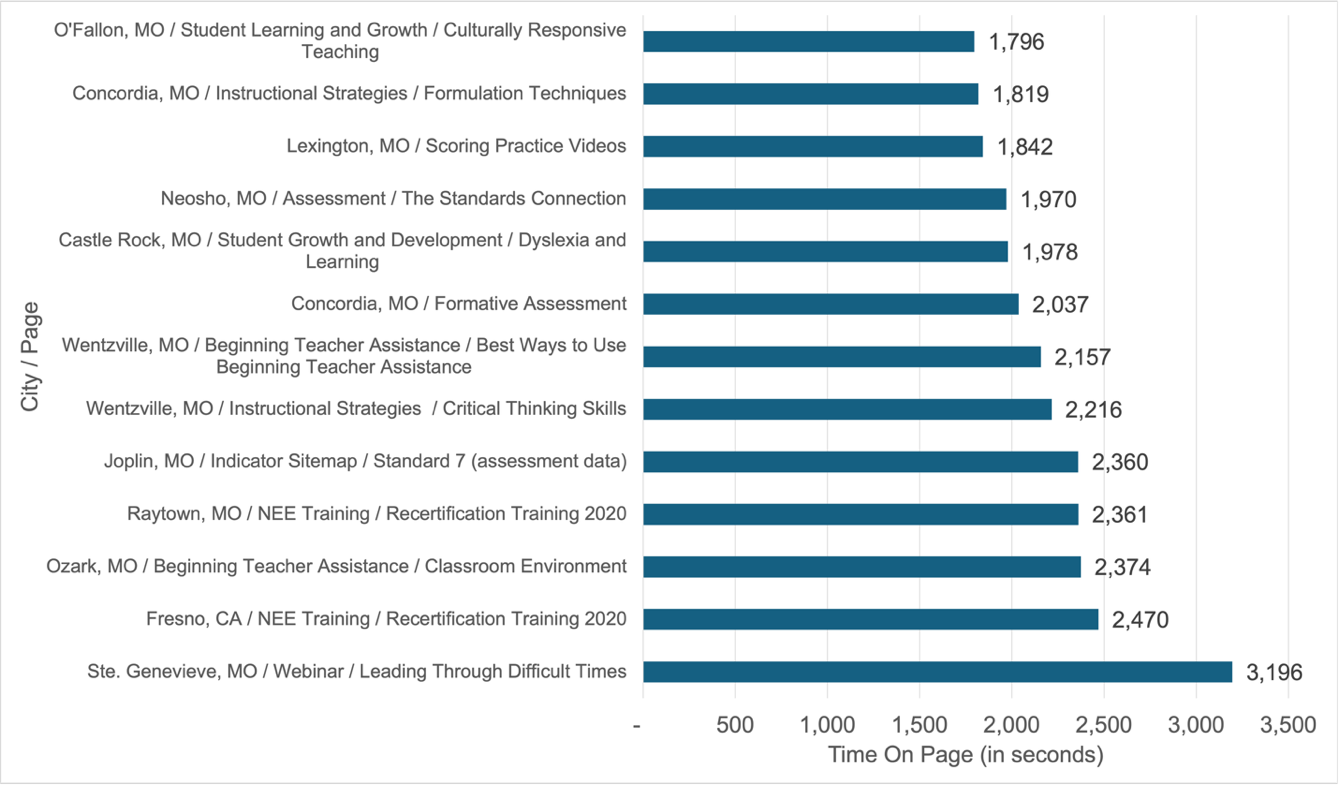
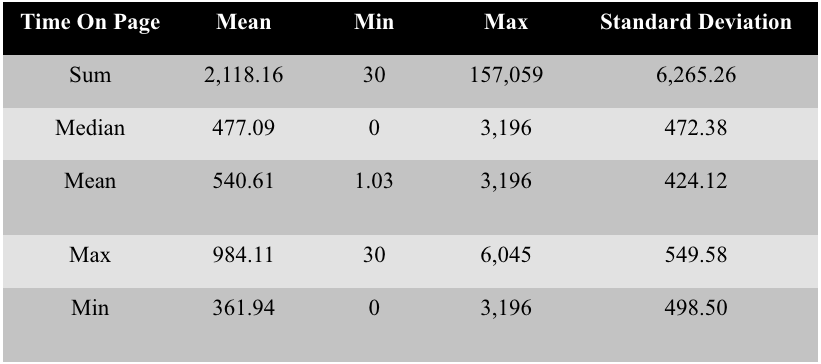
Figure 6 presents the descriptive statistics for the Time On Page variable, revealing significant variability in user engagement with PD resources during the pandemic. The large standard deviations and differences between the minimum and maximum values suggest that some educators engaged with PD longer than others. The mean (540.61 seconds) exceeds the median (477.09 seconds) because outliers inflate the average, indicating a right-skewed distribution. Additionally, a bimodal characteristic is present, as the statistical distribution of Time On Page values exhibits two distinct modes, indicating a large number of users with low engagement and a smaller group with very high engagement.
Figure 6
Anomaly Metrics Summary for Time On Page (in seconds)
The study highlights the key role of online professional development (PD) in assisting educators during crises, especially in smaller districts in Missouri. Time-series clustering and anomaly detection identified general behaviors and moments of significant engagement, showing how the pandemic affected learning needs. The findings are vital for enhancing educators’ human, social, and decisional capital by tailoring online programs to their contexts.
The study highlights practical implications for program managers to tackle disparities in access, skills, and collaboration that hinder educators’ professional growth. Future materials should prioritize targeted support for resource-constrained school districts by promoting virtual collaboration, tailoring content to their professional needs, and investing in digital literacy initiatives to enhance educators’ preparedness for future crises.
This study examined educators’ engagement with online PD during the pandemic through time-series clustering and anomaly detection. Key findings showed that peak engagement periods coincided with school year preparations and the onset of the pandemic, reflecting a surge in demand for remote instruction training. Cluster analysis revealed consistent patterns of resource access, particularly for the Administrator Library, Units of Instruction, and Remote Learning modules. Notable anomalies included high engagement with webinars and training materials. The results underscore the need for targeted support to reduce disparities and strengthen future PD initiatives.