The EdHub Library, developed by the University of Missouri’s Network for Educator Effectiveness (NEE), has offered over 500 self-paced professional development (PD) activities to K-12 educators since 2014. These modules cover various research-based teaching strategies, are available year-round, and have no deadlines. The EdHub Library has served approximately 38,000 educators in Missouri, Nebraska, Kansas, and Vietnam (Leung, 2024).
The COVID-19 pandemic led to a surge in educators seeking PD from online platforms (Dabrowski, 2021). Studies conducted during this period revealed significant gaps in access, which were attributed to differences in technological infrastructure, socioeconomic factors, and regional disparities (Cachón-Zagalaz et al., 2020). These insights highlight equity challenges in educators' engagement with PD platforms (Bao, 2020). The pandemic prompted educators to prioritize PD materials that addressed immediate instructional challenges, such as technology integration and remote classroom management (Reich et al., 2020; Trust & Whalen, 2020). Evaluating online PD platforms is complex due to the diverse needs of educators and the absence of face-to-face interactions, which makes it difficult to generalize measurement and evaluation (Desimone & Garet, 2015; Fishman et al., 2003; Vrasidas & Zembylas, 2004).
The free version of Google Analytics collects data on resource usage in the EdHub Library. It measures various dimensions such as Date (when a resource is accessed), City (user location), and User Type (new vs. returning users). Key metrics include Unique Total Users (unique IDs triggering events), Time On Page (seconds spent on a page for engagement), Count of Sessions (unique sessions defaulting to 30 minutes), Days Since Last Session (days since the last session), and Pageviews (total views of a page). Google Analytics also anonymizes IPs for user privacy.
Google Analytics variables are not designed to track the utilization, retention, and attrition of educational platforms. However, by adapting e-commerce and learning analytics concepts, these variables can help create user engagement metrics to monitor educators' engagement with PD and benchmark educational platforms over time. While Google Analytics can measure short-term engagement, its data retention policy limits long-term tracking of user-level data, such as Unique Total Users and User Type, to 24 months. To address this limitation, a Python script automatically exports Google Analytics data each school year, enabling the creation of new attributes to measure educators' longitudinal engagement with the EdHub Library.
This study aims to derive three key user engagement metrics (utilization, retention, and attrition) from existing Google Analytics variables and to answer the following research questions: RQ1. What are the general characteristics of user access during the pandemic? RQ2. What are users' monthly utilization, retention, and attrition rates during the pandemic?
User engagement metrics, drawn from the e-commerce and learning analytics literature, provide quantitative measures of educators' interactions with resources. By using these metrics, program managers can assess levels of engagement and disengagement with these resources, particularly during times of crisis (Brynjolfsson et al., 2013; Huang et al., 2012; Liu & Arnett, 2000).
This study is divided into two parts: Exploratory data analysis and feature engineering of three user engagement metrics.
Web analytics data were extracted from Google Analytics and analyzed in Jupyter Notebooks over a 10-month period, from March 1 to December 31, 2020. Key variables included Page (PD resource), City (location), Date (user engagement date and time), User Type (new or returning users), and Unique Total Users (total number of users). Three metrics for user engagement were created from Time On Page (engagement measured in seconds), Count of Sessions (total user interactions that end after 30 minutes of inactivity), and Days Since Last Session (the number of days between sessions) (GA4 Analytics Dimensions and Metrics, n.d.).
The study started with an exploratory data analysis using the Tsfresh Python package to examine (1) user engagement peaks and troughs during the pandemic, (2) the distribution of new versus returning users, (3) Unique Total Users by month and location, and (4) descriptive metrics for Time On Page, Count of Sessions, and Days Since Last Session (Tsfresh Introduction, n.d.). Notably, the analysis focused on Time On Page rather than Pageviews to provide a more accurate measure of user engagement, as it accounted for interactions lasting longer than six seconds (Kaushik, 2009), unlike Pageviews, which included even brief interactions.
In the second part of the study, three user engagement metrics (utilization, retention, and attrition) were derived from Google Analytics variables. Calculated monthly and ranging from 0% to 100%, these metrics enabled a monthly examination of user engagement fluctuations during the pandemic (Clow, 2013; Fader & Hardie, 2010; Ho et al., 2015; Long & Siemens, 2014; Picciano, 2012). Key definitions and formulas for these metrics are detailed in Figure 1.
Figure 1
Definitions and Formulas for User Engagement Metrics

RQ1. What are the general characteristics of user access during pandemics?
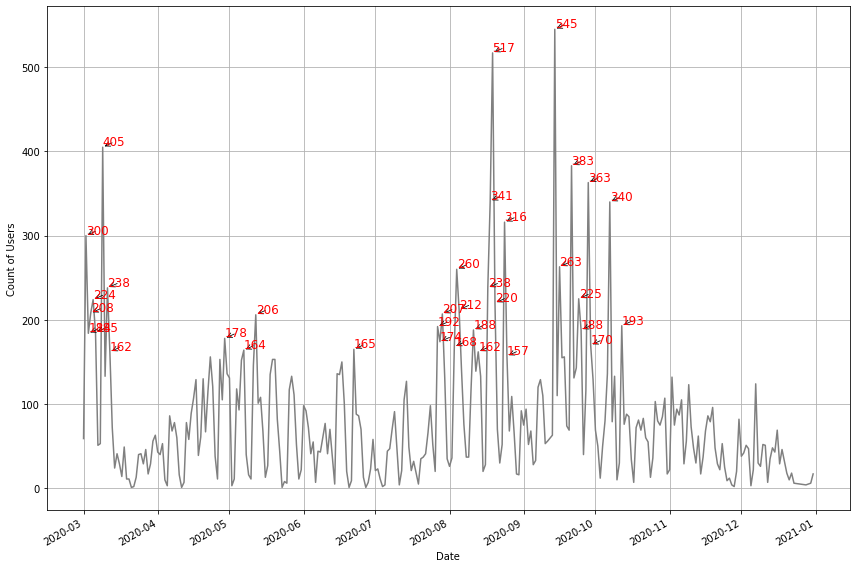
User engagement peaked in March 2020 (pandemic onset) and September–October 2020 (start of the academic year), with 224–545 unique users. Low engagement (under 200 unique users) was observed in June and July, and November and December 2020, as shown in Figure 2.
Figure 2
Peaks in User Engagement From March 1, 2020, Through December 31, 2020
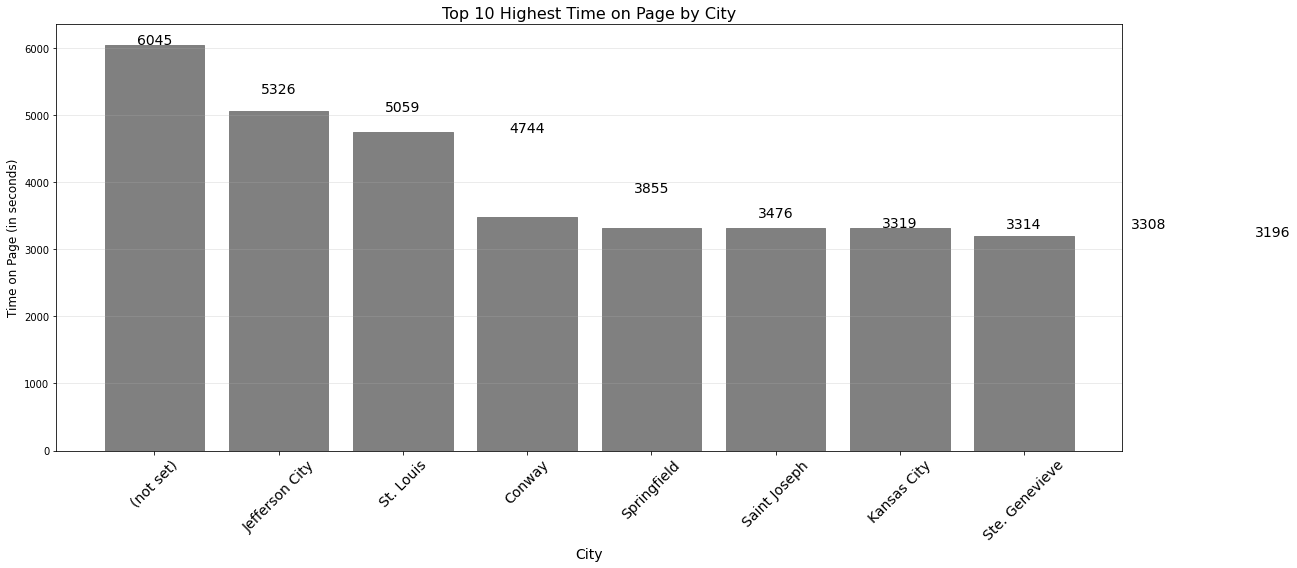
From March to December 2020, as shown in Figure 3, EdHub had 24,147 unique users, with an almost even split between new (12,076) and returning (12,071) visitors, indicating consistent attraction of new users during the pandemic. Figure 4 details top Time On Page locations: VPN users (6,045 seconds), Jefferson City (5,326 seconds), St. Louis (5,059 seconds), and Conway (4,744 seconds).
Figure 3
Distribution of User Types
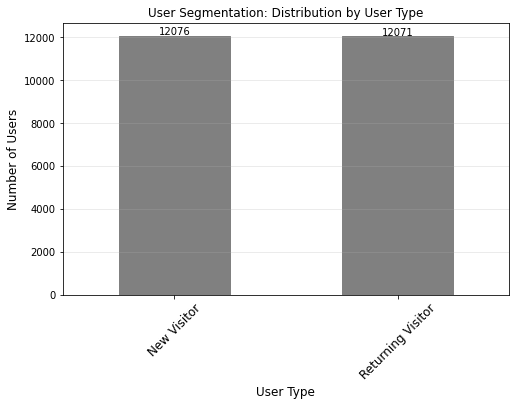
Figure 4
Highest Time On Page by Location
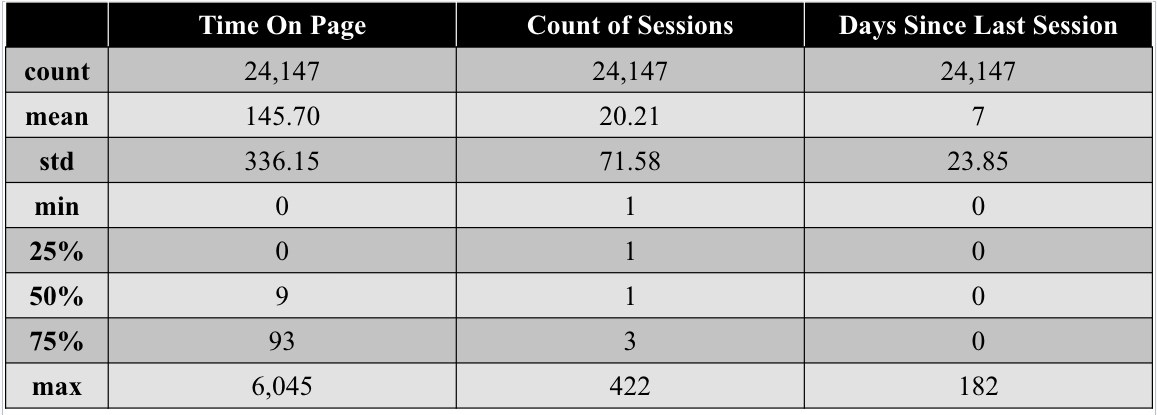
Educators averaged 145.70 seconds on EdHub and 20.21 sessions, and had been less than seven days since their last pandemic-era access, as shown in Figure 5. Outliers exist for each variable, with high values for Time On Page (6,045 seconds) and sessions (422), indicating significant engagement. Conversely, the 182 days since the last session corresponded to the six-month gap between engagement peaks in March and October 2020, as shown in Figure 2.
Figure 5
Descriptive Statistics for Three Variables During the Pandemic (in seconds)
RQ2. What are the monthly utilization, retention, and attrition rates of users during the pandemic?
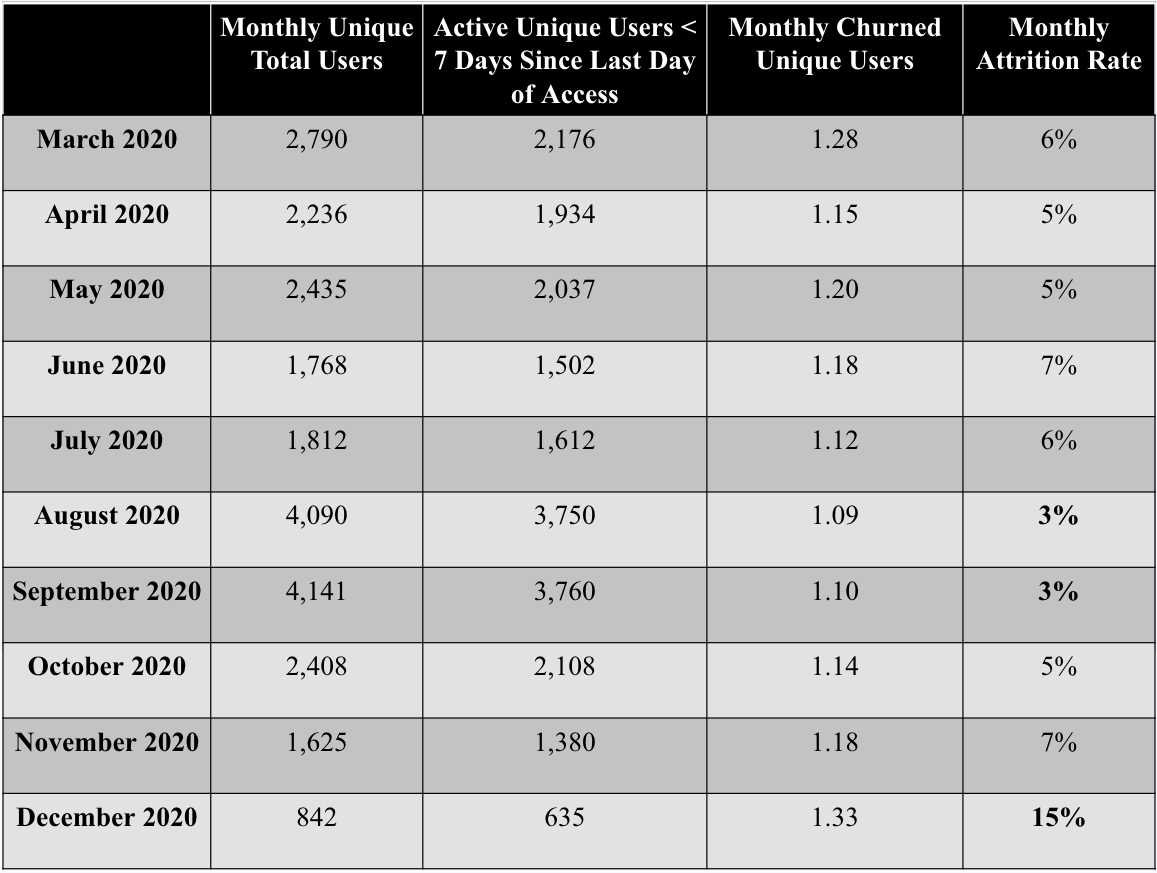
The three user engagement metrics are summarized monthly to capture the highs and lows over the ten-month period. The monthly utilization rate ranged between 3.49% and 17.15%. The lowest utilization rates were observed in November and December 2020, with 6.72% and 3.49%, respectively. The monthly retention rate oscillated between 46.47% and 54.79%. Eight out of the ten months had monthly retention rates above 50%, coinciding with the onset of the pandemic in March, principal training in June, the start of the school year in September, and the end of the school year in December 2020. The monthly attrition rate ranged from 3% to 15%. Interestingly, the lowest attrition rates occurred at the start of the school year in August and September 2020, whereas the highest was observed toward the end of the year. In Figures 6, 7, and 8, monthly rates in bold denote significant utilization, retention, and attrition rates around the beginning of the pandemic and the start and end of the school year.
Figure 6
Monthly Utilization Rate
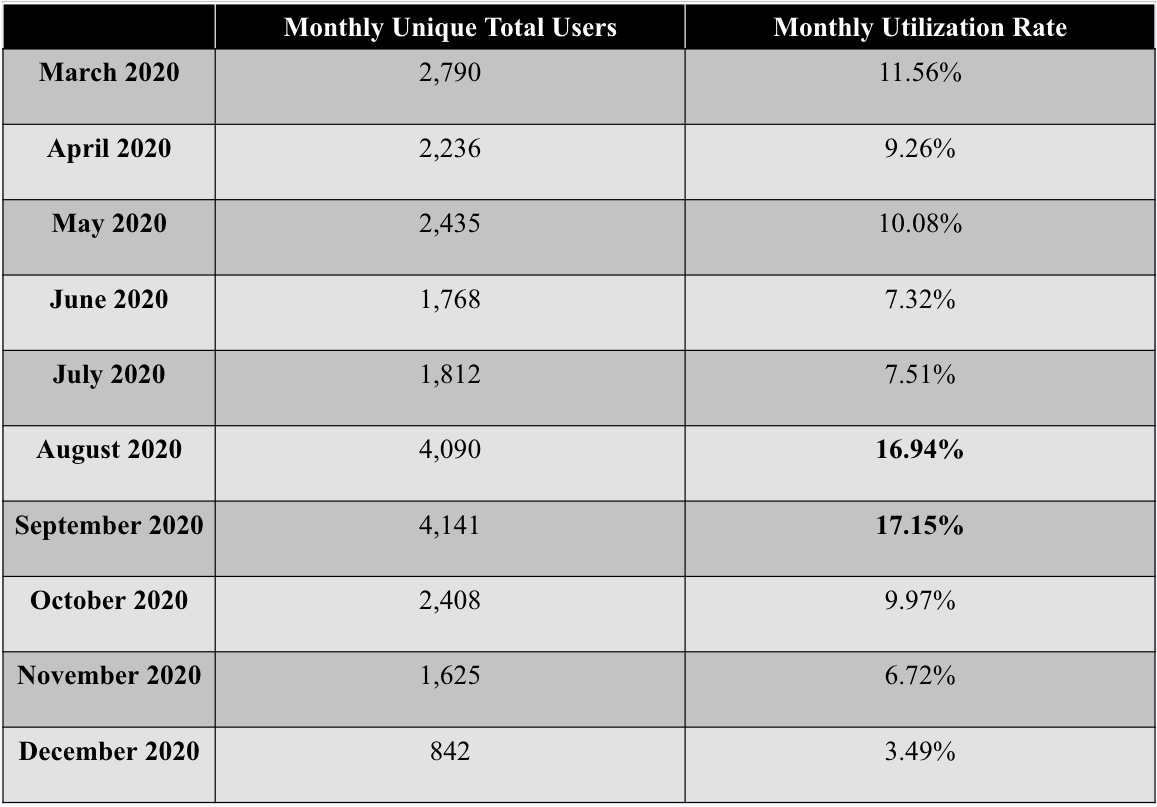
Figure 7
Monthly Retention Rate
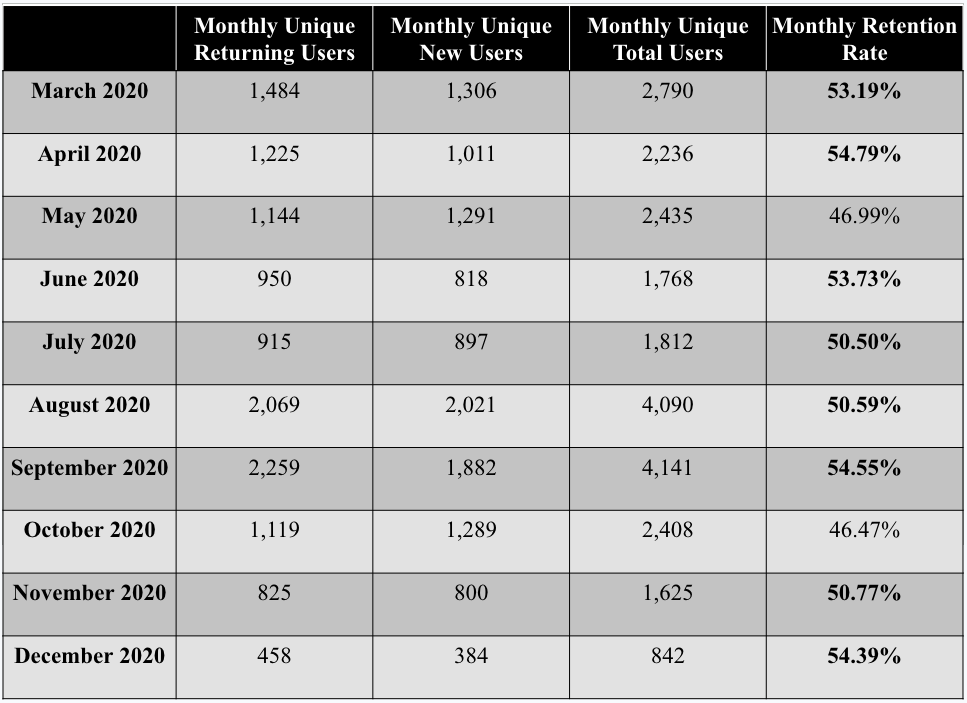
Figure 8
Monthly Attrition Rate
User engagement peaked in March and September–October 2020, with a balance of new and returning users (12,076 vs. 12,071), indicating new user acquisition during the pandemic. The average Time On Page was 145.70 seconds. Retention rates consistently exceeded 50%, with the lowest attrition in August–September, showing engagement above 50% during the ten-month period.
These findings are crucial for improving content sustainability and resource utilization. Data-driven insights enable program managers to engage educators with new PD during high-traffic times and remind them of collaborative efforts during low-traffic periods. These findings also help institutions identify resource gaps, allocate resources effectively, and prioritize initiatives that foster professional growth and continuous improvement by ensuring programs adapt to evolving educational landscapes and technologies.
Deriving user engagement metrics from existing Google Analytics variables helps program managers and stakeholders benchmark the effectiveness of online PD for educators with diverse needs. These findings can empower schools and organizations to create supportive learning environments. This study offers a data-driven approach to establishing user engagement and disengagement baselines for PD resources during crises and to documenting the role of the EdHub Library during the pandemic.