Debugging is a critical skill in programming, yet novice learners often struggle to approach it systematically and effectively. Research in block-based programming (BBP) shows that structured debugging support can enhance students’ comprehension, problem diagnosis, and success in fixing errors (Fitzgerald et al., 2008; Yang et al., 2024). In practice, however, beginners often rely on inconsistent trial-and-error, highlighting the need for models that better reflect and guide their actual debugging processes.
Guided by prior work on novice debugging and structured instructional models, this study adopted the five-step structure synthesized in Yang’s (2024) framework, supported by broader debugging research (Ahn et al., 2022; Askarnia et al., 2025; Sun et al., 2024), to investigate how students apply debugging strategies across four BBP modules. These steps are summarized in Table 1.
Table 1
Steps Description and Methods to Support Them
Code | Operational Step Name | Description and Supporting Methods |
|---|---|---|
a | Understand Problem | The student reads, observes, and replays the code to identify what the program does and reproduce the issue. (Ahn et al., 2022; Wong et al., 2024) |
b | Observe Code | Student examines blocks, variable states, and logic patterns to locate inconsistencies or suspect areas. (Fitzgerald et al., 2008; Tenorio Melenje et al., 2019) |
c | Identify Error | Student pinpoints the exact bug or logic flaw that causes the unexpected output. (Askarnia et al., 2025; Chuang & Chang, 2024) |
d | Fix & Test | Student modifies one part of the code at a time, runs tests, and verifies corrections. (Mehraban & Hu, 2024; Strijbol et al., 2024; Yang et al., 2024) |
e | Document & Reflect | Student records the debugging steps, explains reasoning, and reflects on what was learned or improved. (DeLiema et al., 2019; Rahimi et al., 2025; Sun, Yang & Becker, 2024) |
These steps provided a consistent structure for analyzing students’ coding journal entries and for linking strategy use to their learning performance. This approach allows examination of both the frequency and the depth of students’ debugging engagement. Based on these goals, the study addressed three major research questions:
RQ1. How do students use debugging strategies within and across modules?
RQ2. How are individual debugging steps related to module scores?
RQ3. How do cumulative debugging behaviors across modules relate to learning performance?
This study employed a quantitative correlational design to examine the relationship between students’ debugging behaviors and their performance in a BBP course. Participants were 150 undergraduates enrolled in an asynchronous “Computing and IT” course at a southwestern university during the 2024-2025 academic year. Across four debugging-focused programming modules, students submitted 511 coding journal entries. These Scratch Programming Modules are:
Quiz Show (QSH): Debugging conditional logic, answer checking, and variable updates.
Rock–Paper–Scissors (RPS): Fixing randomization, comparison logic, and win–loss outcomes.
Binary Birthday Cake (BBC): Debugging loops, binary value logic, and sprite activation.
Platformer Game (PG): Correcting movement, collision detection, and scoring behaviors.
The structure of Yang’s (2024) framework was used to guide the interpretation and consistency of these steps. Coding was conducted using a Zero-Shot Classification approach in which a large language model evaluated whether each step description was entailed by the student’s journal text. Ten percent of entries were manually double-coded, yielding high inter-rater reliability (κ = .87). Analyses included frequencies, independent t-tests, and Pearson correlations to examine how debugging behaviors related to module scores and final grades.
Debugging strategy use within and across modules (RQ1).
Across the 511 coding journal entries, students used the debugging steps with distinct patterns. Understand Problem (a) and Identify Error (c) were the most frequently used steps overall, appearing consistently across all four modules. Observe Code (b) showed moderate but stable use. In contrast, Fix & Test (d) and especially Document & Reflect (e) appeared infrequently, with step e nearly absent in several modules.
Table 2
Steps Frequency
Module | a (Understand Problem) | b (Observe) | c (Identify Error) | d (Fix & Test) | e (Document) |
|---|---|---|---|---|---|
QSH | 43(28%) | 36(24%) | 29(19%) | 34(22%) | 7(4.7%) |
RPS | 67(42%) | 44(28%) | 21(13%) | 27(17%) | 0(0%) |
BBC | 73(44%) | 35(21%) | 17(10%) | 37(22%) | 1(0.6%) |
PG | 37(27%) | 51(38%) | 25(18%) | 21(15%) | 1(0.7%) |
Total | 220(35%) | 166(27%) | 92(15%) | 119(19%) | 9(1.4%) |
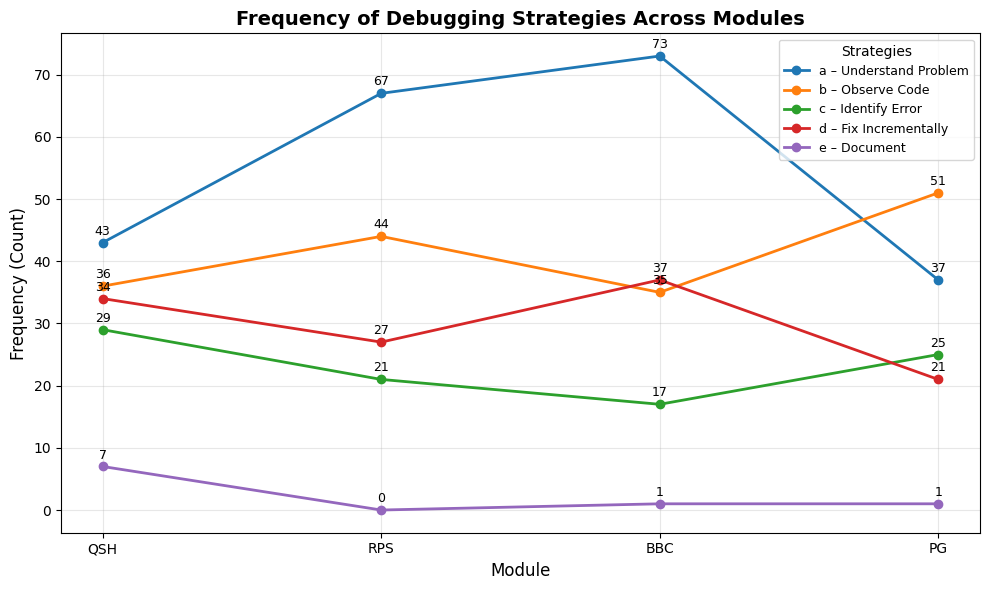
A visual trend shows that step a peaks in the BBC module, while step c increases again in the PG module. Step e remains below 2 percent across all modules, indicating minimal use of reflective behaviors in student debugging.
Figure 1
Frequency of Debugging Strategies Across Modules
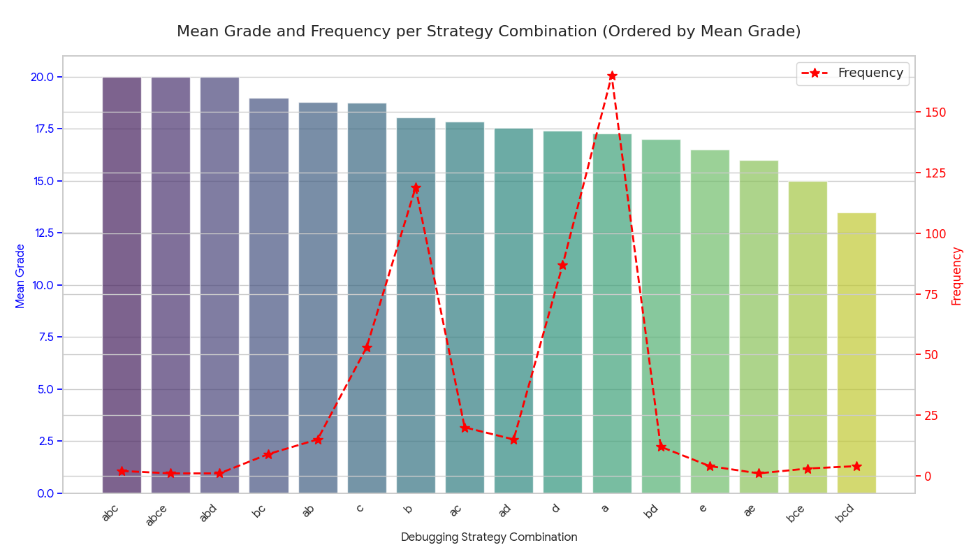
The most common combinations were single or two-step patterns. After “a”, “b”, “d”, and “c”, the combinations “ac”, “ad”, and “ab” accounted for the majority of entries. When combinations were ranked by mean module score, higher-scoring patterns tended to include Identify Error (c). Low-frequency combinations involving three or four steps achieved the highest average scores, but their very small counts prevent meaningful statistical comparison. Therefore, combination results are reported descriptively rather than inferentially (see Table 2).
Figure 2
Combinations of Strategies
Note.Relationship between individual steps and module scores (RQ2)
Independent t-tests showed that students who used Identify Error (c) scored significantly higher on modules than those who did not (p=.04). No other step showed statistically significant differences (see Table 3), though small positive trends were observed for Understand Problem (a) and Fix & Test (d).
Table 3
Independent t-test between two groups
Steb | Mean score on Used | Mean score on Not Used | P-value | Interpretation |
|---|---|---|---|---|
a | 17.50 | 17.85 | .25 | No significant difference, scores were similar |
b | 17.97 | 17.57 | .18 | Slightly higher score for those who used b |
c | 18.27 | 17.57 | .04 | Significant difference, students who used c scored higher |
d | 17.26 | 17.83 | .14 | No significant difference, trend toward lower scores with d |
e | 16.33 | 17.72 | .39 | No significant difference, e users were few and low-scoring |
Analysis of module-level step counts showed the following patterns (see Table 4).
Table 4
Step frequency within each module and module scores
Number of Steps | Average Module Score | Number of Entries |
|---|---|---|
1 | 17.69 | 428 |
2 | 17.95 | 72 |
3 | 15.90 | 10 |
4 | 20.00 | 1 |
5 | N/A | 0 |
These results suggest that adding more steps does not consistently raise module scores at the individual-module level, although extremely high step counts may reflect more thorough debugging, given the very small sample sizes.
Cumulative debugging behavior and overall learning performance (RQ3)
The total number of steps across all modules showed a moderate, significant positive correlation with average module scores (r = .292, p < .001). Average scores generally increased as total steps increased (see Table 5). Students who engaged in more debugging overall tended to earn higher module scores.
Table 5
Module-Level Step Count and Average Module Score
Steps Count | Student Count | Average Module Score |
1 | 5 | 12.93 |
2 | 13 | 16.09 |
3 | 27 | 17.73 |
4 | 57 | 17.46 |
5 | 29 | 17.49 |
6 | 15 | 18.43 |
7 | 2 | 19.00 |
8 | 1 | 19.50 |
9 | 1 | 19.75 |
A similar pattern emerged for final grades (r=.284, p<.01). Grades were lowest among students with only 1–2 steps across all modules and plateaued at higher levels for students using 3–6 steps. More step engagement corresponded with stronger overall course performance (see Table 6).
Table 6
Frequency of steps across modules and final course grades
Steps Count | Student Count | Average Final Grade |
|---|---|---|
1 | 5 | 0.71 |
2 | 13 | 0.77 |
3 | 27 | 0.85 |
4 | 57 | 0.85 |
5 | 29 | 0.87 |
6 | 15 | 0.88 |
7 | 2 | 0.86 |
8 | 1 | 0.89 |
9 | 1 | 0.96 |
The number of strategy types used across modules showed a small, non-significant association with average module scores (r = .148, p = .07). This suggests a mild trend toward benefit from using a broader set of strategies, but the effect is weaker than that of total step count (see Table 7).
Table 7
Number of Strategy Types Used Across Modules and Learning Outcomes (Student-Level)
Number of Strategy Types | Student Count | Average Module Score | Average Final Grade |
|---|---|---|---|
1 | 18 | 16.04 | 0.79 |
2 | 59 | 17.67 | 0.85 |
3 | 56 | 17.29 | 0.85 |
4 | 16 | 18.24 | 0.86 |
5 | 1 | 20.00 | 0.99 |
Also, the number of strategy types showed a similarly small, positive but non-significant correlation with final grades (r=.153, p=.06). Students who used only one strategy type earned lower grades, while those using two to four types scored consistently high (see Table 7). The highest grade belonged to the single student who used all five strategy types.
This study investigated how students applied a five-step debugging framework in a block-based programming course and how these behaviors related to learning outcomes. Identify Error emerged as the strongest contributor to module success, while overall engagement, measured by total steps used across modules, was the most consistent predictor of higher average module scores and final grades. Strategy variety showed only a modest positive trend, suggesting that consistent debugging practice matters more than the number of different strategies used.
These results suggest that instruction should emphasize accurate error identification, systematic fix-and-test cycles, and structured reflection. Providing prompts and guided examples may strengthen these behaviors. Future research should track how debugging behaviors evolve over time and test targeted supports designed to increase the use of less frequent steps, particularly reflection.