Professional development (PD) generally aims to provide opportunities to support educators in honing their craft, exploring emerging technologies and innovative teaching techniques, networking, and considering the future of their practice (McLean et al., 2008). This is beneficial within all disciplines, especially the health sciences, where many educators have received extensive training in their clinical disciplines but less training related to pedagogy and educational technology. Because of this context, evaluation of PD programs often focuses on the ability of training to increase participants’ knowledge, skills, self-confidence, and self-efficacy (Leslie et al., 2013; Palmer et al., 2016). These are important metrics, but it is also critical to understand how PD contributes to changes in educators’ beliefs and attitudes about their teaching philosophy. Additionally, it’s valuable for educators to have time and space to reflect on their own teaching practices and to consider how their personal values impact their facilitation of the learning environment.
This study implemented the Organizational Culture Assessment Instrument for Classrooms (OCAI-C; Battelle for Kids, 2013; Quinn et al., 2014) in a novel way toward assessing a PD program by using data to visualize participants’ teaching philosophies. The OCAI-C is based on the Competing Values Framework (CVF; Quinn & Rohrbaugh, 1981) that recognizes we all must navigate underlying tensions when making decisions. The CVF framework was operationalized in the Organizational Culture Assessment Instrument (Cameron & Quinn, 2006; Helfrich et al., 2007), which has been validated in numerous contexts and then further adapted for classroom use as the OCAI-C. To conceptualize this model, consider that when designing an assessment, an educator might allow for unlimited creativity or they might provide a standardized task. These options are equally valid, but they cannot both be done at the same time. Based on this idea, the OCAI-C asks educators to consider inherent tensions across six aspects of classroom culture: dominant characteristics, teacher attention, classroom management, classroom glue, strategic emphasis, and criteria of success (Battelle for Kids, 2013; Quinn et al., 2014).
Unlike Likert-style questions, for which a respondent indicates perceptions about independent statements, in each OCAI-C aspect, participants must distribute 100 points across four choices. This format represents how the choices are intrinsically related and mirrors the tensions that are present in the decision-making. For example, within the classroom management aspect, participants must decide how strongly they feel toward each of the following statements (Quinn et al., 2014) and distribute their points accordingly: “My classroom management style gives rise to…”:
“student involvement, participation, and collaboration.” (Statement A)
“student autonomy, experimentation, and creativity.” (Statement B)
“student determination, industriousness, and extra effort.” (Statement C)
“a sense of student security, predictability, and stability.” (Statement D)
While an educator can value all four of these ideas, they must make decisions about the extent to which they prioritize each. For example, in this aspect, one person might distribute 20 points to Statement A, 30 points to Statement B, 50 points to Statement C, and 0 points to Statement D. Whereas someone else might distribute 60 points to Statement A, 10 points to Statement B, 15 points to Statement C, and 15 points to Statement D. These examples highlight that there are not “right” or “wrong” ways to allocate the points, but rather that these distributions indicate distinct profiles or descriptions of educators’ priorities.
After distributing 100 points across each of the six aspects of culture, a resultant plot can help to visualize the average value that was allocated to each of the four statements that map onto quadrants representing, respectively, relationships, continuous improvement, high expectations, and stable environment (Figure 1). In fact, the tool is designed to be completed twice. The first time, respondents can complete the instrument based on their current practices, and the second time, they can indicate what they would like to do in the future. Examining the results of the OCAI-C can help to identify a profile of an educator’s current classroom culture and provide a tool to visualize the change needed in order to reach their own desired culture.
Figure 1
Example OCAI-C Plot
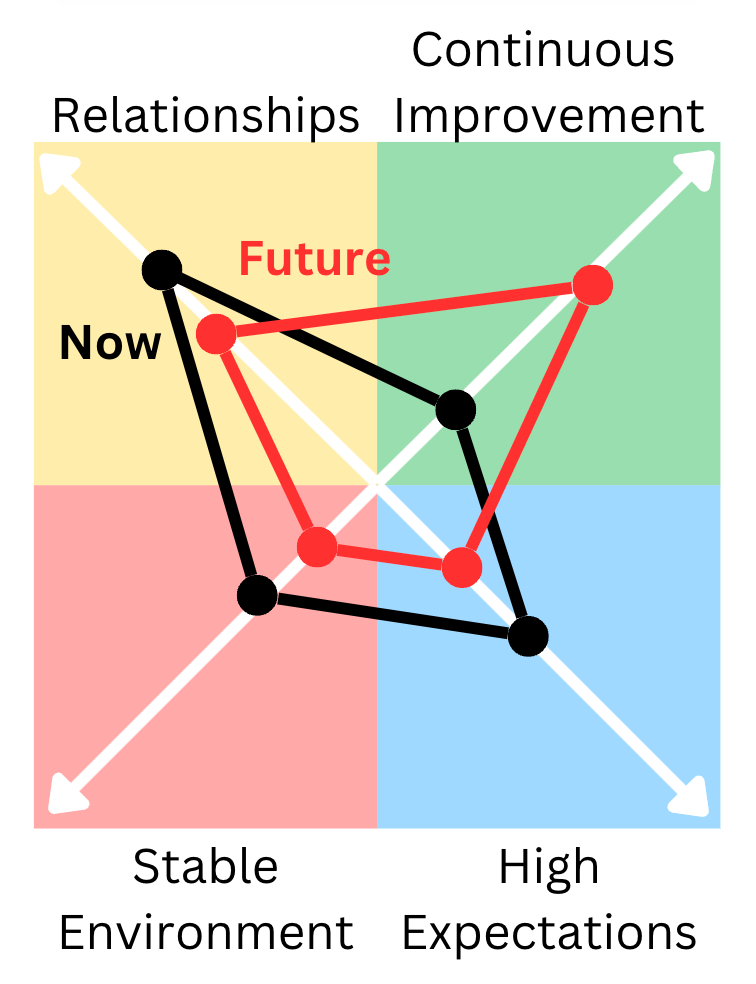
Note. This graph shows an example of points distributed across each of the four quadrants to represent an educator’s beliefs about their classroom culture now (black) and in the future (red). Figure adapted from Battelle for Kids. (2013). Organizational Culture Assessment Instrument for Classrooms. https://static.battelleforkids.org/images/connect/Organizational-Culture-Assessment-Instrument-for-Classrooms.pdf. Copyright 2013 by Battelle for Kids.
The OCAI-C serves as a powerful tool for promoting reflection amongst individuals and teams. However, when used in a novel way for research and assessment, it was hypothesized that the OCAI-C could add insight into how educators’ perspectives change as a function of a PD intervention. The Teaching & Learning Center at A.T. Still University offers a seven-week program called the Course Design Institute (CDI) that is available for educators at the all-graduate and post-professional health sciences institution. Through this course, participants learn about student-centered instruction and gain hands-on experience (re)designing instruction using the backward design process. While prior data have measured impacts of this course on knowledge and skills related to course design principles (Speer et al., 2022), little is known about how participants’ teaching philosophies might shift as a function of the training. Therefore, in this study, the OCAI-C was adapted to measure the impacts of this PD program on educators’ perspectives and values about teaching. During the pretest and posttest of the CDI, educators were asked to reflect on how they see their current classroom culture as a way to assess beliefs before participating in the training and how they plan to teach after.
OCAI-C results from CDI participants (n=23) were analyzed to identify patterns. The points allocated to each OCAI-C quadrant (relationships, continuous improvement, high expectations, and stable environment) were calculated from the pretests and posttests, and pair-wise changes between the distribution of points on these instruments were assessed. Additionally, relative preference toward any one quadrant (defined as “dominance”) at each time point was calculated.
The findings contribute to elucidating how teaching approaches and philosophies can change over time, especially through engagement with PD opportunities. Results of a χ2 test indicate an association between the way that participants allocated points in the instrument and their training status (pre- or post-training, p<0.0001). Prior to the CDI, faculty on average allocated more points toward relationships than they did to continuous improvement, high expectations, or stable environment (Table 1). After the training, more points were allocated on average to relationships and continuous improvement (average % change = 16.8 and 15.8, respectively, Table 1), and concomitantly, fewer points were allocated to high expectations and stable environments (average % change = -20.8 and -18.2, respectively, Table 1). While the majority of faculty retained dominance toward a particular quadrant after the training, equal numbers of faculty (n=6) had a change in dominance (their priority shifted to a new quadrant), as their dominance had strengthened (more points allocated to the same quadrant that had previously been dominant).
Diverse and unique profiles of classroom culture were seen across the 23 participants, and different patterns of changes in beliefs were also seen. For example, some participants exhibited drastic changes in their priorities (e.g., most points allocated to high expectations and stable environment before participating in the CDI, and then most points allocated to relationships and continuous improvement after the training), while others showed more subtle shifts in how they distributed their points.
Table 1
Distribution of 100 Points to the Four Quadrants in the OCAI-C
Relationships (mean, SD) | Continuous Improvement (mean, SD) | High Expectations (mean, SD) | Stable Environment (mean, SD) | |
Pre | 30.40, 8.24 | 24.02, 5.47 | 24.24, 6.18 | 21.34, 7.17 |
Post | 35.51, 9.70 | 27.83, 8.16 | 19.20, 8.19 | 17.46, 7.32 |
These data suggest that for some participants, the CDI altered their teaching priorities, while for others it reaffirmed their beliefs. The range in participants’ profiles also validates the diversity that can exist amongst educators related to their teaching beliefs and priorities for their classroom culture. Taken together, these data demonstrate ways in which the CDI contributed to attitudinal impacts for many participants and help to make the often-invisible affective outcomes of PD more visible.
This study’s limitations offer opportunities for further study. For example, continued research is needed to explore how the OCAI-C results might map onto how educators actually design and facilitate their instruction and to examine what their priorities mean to them in their teaching. Additionally, all participants in this study were health science educators, and ongoing research should continue to explore the use of the OCAI-C in a wider range of teaching contexts (K-12, undergraduate, and graduate) and disciplines. Nevertheless, these findings serve as proof of concept toward not only using the OCAI-C as a reflective practice but also as a tool for research and assessment of PD programs.