Spatial thinking involves the mental ability to generate, rotate, and transform visual images to understand and reason about spatial relationships between objects (Lohman, 1996). Research shows a strong positive relationship between spatial abilities and success in STEM fields (Kell et al., 2013; Ramful et al., 2017; Shea et al., 2001; Uttal & Cohen, 2012; Wai et al., 2009). Despite this connection, K-12 curricula largely neglect spatial ability development (Kris, 2016; Wai et al., 2009), missing opportunities within STEM subjects that naturally provide authentic contexts for such skills (National Research Council, 2006). Traditional research has examined spatial thinking in isolation rather than within specific STEM contexts (Uttal & Cohen, 2012). Adopting a discipline-based approach (Sun et al., 2024), this study investigated K-12 students' spatial thinking development through 3D Weather learning modules that integrate spatial and computational thinking for weather data visualization tasks and problem-solving.
Funded by the NSF STEM+C program, the 3D Weather project developed IDV (Integrated Data Viewer downloadable at https://www.unidata.ucar.edu/software/idv/) weather data visualization modules and offered summer workshops to prepare teachers to teach the modules in their classrooms. This study reports the student learning outcomes of the modules.
Spatial thinking plays a critical role in STEM success, influencing students' ability to interpret diagrams, manipulate objects, and solve complex problems (Newcombe, 2010; Uttal et al., 2013). While general spatial skill tests measure broad abilities such as mental rotation and visualization (Carroll, 1993; Lohman, 1996), they do not fully capture how spatial thinking manifests within specific STEM disciplines. Prior research highlights the discipline-specific nature of spatial thinking, noting that experts apply complex spatial reasoning intertwined with domain knowledge (National Research Council, 2006; Uttal & Cohen, 2012). For instance, spatial visualization is crucial in chemistry and molecular biology for interpreting three-dimensional molecular structures, while spatial orientation skills are emphasized in engineering and physics (Sorby, 2009)
The 3D Weather project adopts this discipline-based perspective, integrating computational thinking skills—task decomposition, systems thinking, pattern recognition, and generalization (Brennan & Resnick, 2012; Grover & Pea, 2013; Wing, 2006), with spatial reasoning in weather visualization. The resulting Spatial Computational Thinking Model (Sun et al., 2024) captures how students engage in meteorological problem-solving by visualizing atmospheric processes in three dimensions.
Figure 1
3D Weather Spatial Computational Thinking Model (Sun et al., 2024)
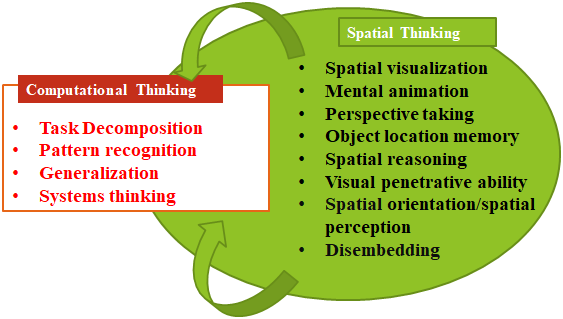
The 3D Weather Spatial Computational Thinking Model (Figure 1) was developed by the 3D Weather project team through a Delphi study to capture the two inseparable cognitive dimensions (i.e., the Computational Thinking dimension and the Spatial Thinking dimension) in geospatial analysis or weather visualization tasks (Sun et al., 2024). The 3D Weather project developed 24 IDV modules based on severe weather events, requiring students to use these combined skills. For example, Module 11 uses IDV to visualize wind and pressure patterns of the 1993 Super Storm.
Figure 2
Visualizing Wind and Pressure Patterns of 1993 Super Storm on 3/13/1993

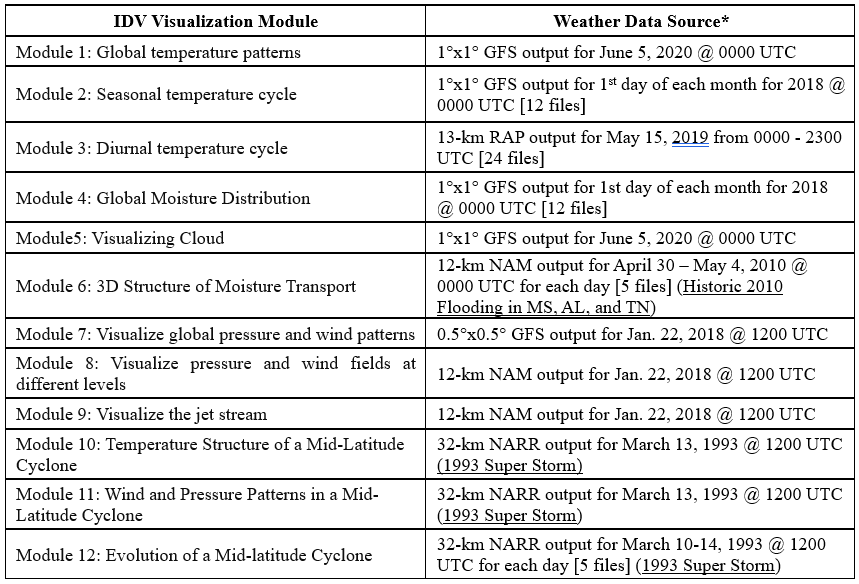
The 3D Weather project offered annual two-week summer workshops (2021-2023) for K-12 teachers. Week one provided online instruction via Canvas covering temperature, atmospheric moisture, pressure, and wind, mid-latitude cyclones and fronts, plus a spatial computational thinking skills overview. Week two involved in-person IDV weather data visualization training. Fifteen teachers attended the 2023 workshop, subsequently teaching Modules 1-12 during Fall Intersession, October 2023, organized into four thematic units.
Table 1
Modules 1-12 Implemented by 2023 Teacher Cohort
This study employed a pre-post quantitative design, collecting learning outcome data from students whose teachers implemented 3D Weather IDV visualization modules 1-12 during Fall Intersession in October 2023. The study addressed two research questions: (1) What are the effects of the 3D Weather modules on students' general spatial thinking and spatial computational thinking development? and (2) Is spatial computational thinking related to general spatial thinking?
Participants were students of the fifteen teachers who attended the 2023 3D Weather workshop and subsequently taught the modules (Table 1) in their classrooms. Of these students, 139 returned both parental permission and assent forms with complete data. These 139 students comprised the study sample, with demographics presented in Table 2.
Table 2
3D Weather 2023 Student Participant Demographics
Category | n | |
Gender | Male | 65 |
Female | 74 | |
Race | White/Caucasian | 39 |
Non-White (African American/Black: 84; Native American: 14; Multiracial: 2) | 100 | |
Grade Level | 4th grade | 42 |
5th grade | 33 | |
7th grade | 6 | |
8th grade | 5 | |
9th grade | 15 | |
10th grade | 18 | |
11th grade | 19 | |
12th grade | 1 | |
The S-CT Test consists of 17 multiple-choice items: seven measure general spatial skills, and ten measure contextualized S-CT through IDV weather visualization tasks. Each correct answer earns one point. Students’ answers to these items were graded as “correct” or “wrong” and each correct answer was given one point.
The 3D Weather S-CT Test was given to the students before and after learning Modules 1-12 (Table 1). Each student had four test scores: (1) pretest score of general spatial thinking (PreST); (2) pretest score of spatial computational thinking (PreS-CT); (3) posttest score of general spatial thinking (PostST); and (4) posttest of score of spatial computational thinking (PostS-CT). Dependent samples t-test and Pearson correlation analysis were conducted to analyze the data.
The descriptive statistics for the scores of PreST, PostST, PreS-CT, and PostS-CT are reported in Table 3.
Table 3
Descriptive Statistics
Variable | Descriptive Statistics | |||||
Mean | MD | SD | Range | Min | Max | |
PreST | 2.68 | 2.00 | 1.43 | 6.00 | 0.00 | 6.00 |
PostST | 2.89 | 3.00 | 1.48 | 6.00 | 0.00 | 6.00 |
PreS-CT | 3.33 | 3.00 | 1.44 | 7.00 | 0.00 | 7.00 |
PostS-CT | 3.65 | 4.00 | 1.42 | 8.00 | 0.00 | 8.00 |
The Shapiro-Wilk test results indicate that PreST and PostST scores are not normally distributed. Therefore, Wilcoxon signed-rank test was conducted to compare PreST and PostST scores. The test result indicates that the students’ PostST scores (MD = 3.00, n = 139) were not significantly different from their PreST sores (MD = 2.00, n = 139), z = 1.301, p = 0.193.
The Shapiro-Wilk test results indicate that PreS-CT and PostS-CT scores are not normally distributed. Therefore, Wilcoxon signed-rank test was conducted to compare PreS-CT and PostS-CT scores. The test result indicates that the students’ PostS-CT scores (MD = 4.00, n = 139) were significantly higher than their PreS-CT sores (MD = 3.00, n = 139), z = 2.017, p = .044, r = 0.17.
Two Spearman correlation tests were conducted with one on PreST and PreS-CT scores and the other on PostST and PostS-CT scores: (1) there was not a significant positive correlation between PreST scores (MD = 2.00, n = 139) and PreS-CT scores (MD = 3.00, n = 139), rs(137) = .160, p = .061, and (2) there was a significant correlation between PostST scores (MD = 3.00, n = 139) and PostS-CT scores (MD = 4.00, n = 139), rs(137) = .210, p = .013.
The findings indicate that the 3D Weather modules effectively develop contextualized spatial computational thinking but do not significantly influence general spatial skills. This aligns with the discipline-based perspective that spatial thinking develops within specific contexts (National Research Council, 2006; Uttal & Cohen, 2012). The modules required students to visualize atmospheric structures, interpret multi-layered data, and apply computational thinking strategies (Brennan & Resnick, 2012; Grover & Pea, 2013), promoting growth in S-CT as students engaged in authentic meteorological problem-solving tasks (Sun et al., 2024). The emergence of a significant post-test correlation between ST and S-CT suggests cognitive alignment: students began drawing from general spatial abilities when solving discipline-specific tasks. This reinforces the idea that while general spatial skills measured by traditional psychometric tests (Lohman, 1996; Carroll, 1993) are relatively stable, they can be leveraged more effectively when instruction integrates spatial reasoning with domain knowledge and authentic STEM contexts (Uttal & Cohen, 2012).
This study demonstrates that contextualized spatial computational thinking can be effectively developed through targeted STEM instruction, even when general spatial thinking remains unchanged, underscoring the importance of embedding spatial thinking within authentic, domain-specific tasks (National Research Council, 2006; Sun et al., 2024; Uttal & Cohen, 2012). Limitations include the meteorology-specific focus and short one-week intervention period. Future research should examine transfer to other STEM domains and conduct longitudinal studies. Educators should intentionally integrate spatial and computational reasoning within real-world problem-solving tasks (Brennan & Resnick, 2012; Grover & Pea, 2013), addressing curriculum gaps in spatial ability development (Kris, 2016; Wai et al., 2009).